![[Experimental]](figures/lifecycle-experimental.svg)
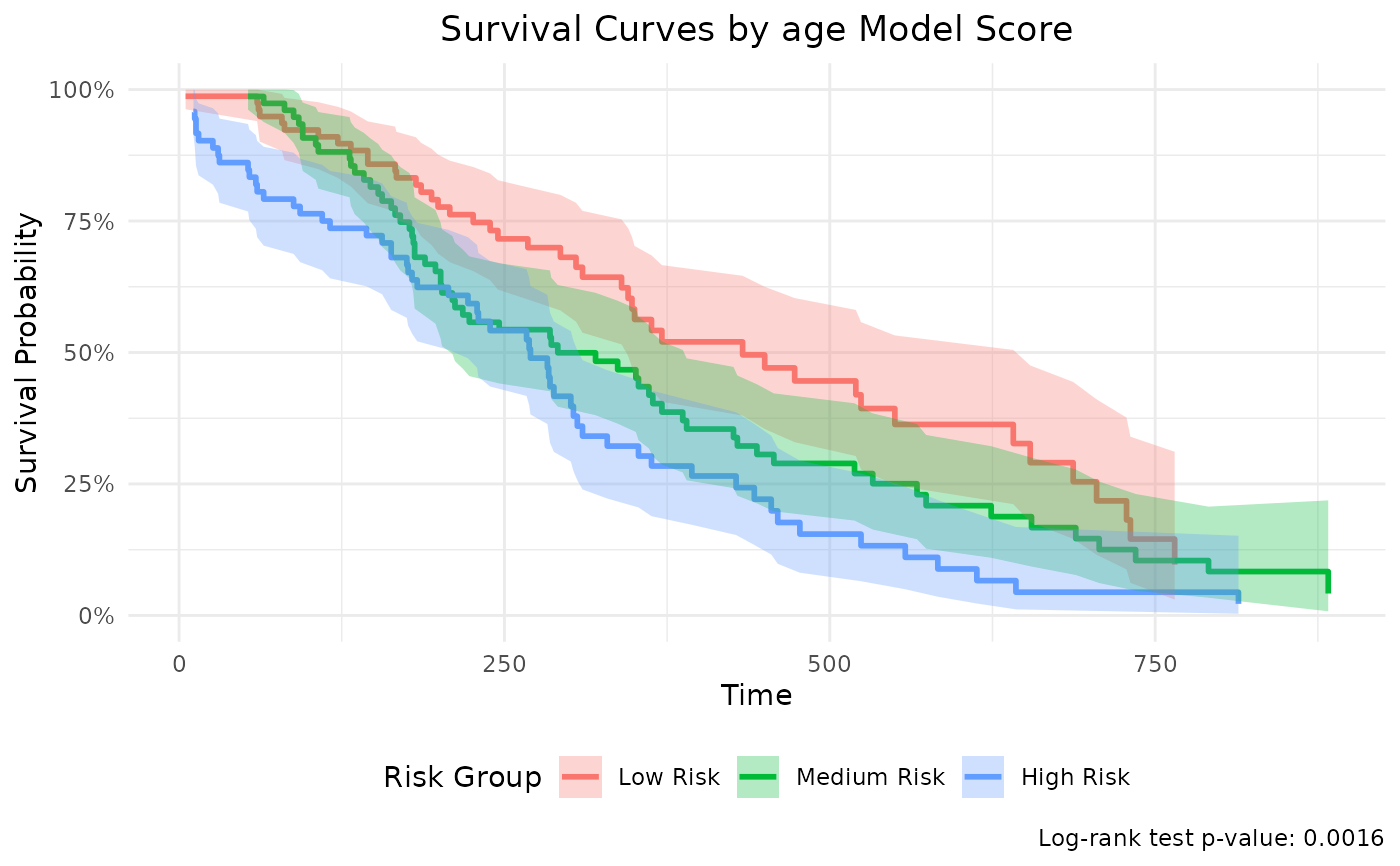
Generate survival curves by grouping observations based on model prediction scores. This function is specifically designed for Cox regression models and creates survival curves comparing different risk groups.
Usage
br_show_survival_curves(
  breg,
  idx = NULL,
  n_groups = 3,
  group_labels = NULL,
  title = NULL,
  subtitle = NULL
)
Arguments
- breg
A
bregobject with fitted Cox regression models.- idx
Index or name of the model to use for prediction. If NULL, uses the first model.
- n_groups
Number of groups to create based on score quantiles. Default is 3.
- group_labels
Custom labels for the groups. If NULL, uses "Low", "Medium", "High" for 3 groups or "Q1", "Q2", etc. for other numbers.
- title
Plot title. If NULL, generates automatic title.
- subtitle
Plot subtitle.
Examples
# \donttest{
# Cox regression example with survival curves
if (requireNamespace("survival", quietly = TRUE)) {
  lung <- survival::lung |> dplyr::filter(ph.ecog != 3)
  mds <- br_pipeline(
    lung,
    y = c("time", "status"),
    x = c("age", "ph.ecog"),
    x2 = "sex",
    method = "coxph"
  )
  p <- br_show_survival_curves(mds)
  print(p)
}
#> exponentiate estimates of model(s) constructed from coxph method at default
#> `idx` not set, use the first model

# }
# }