![[Experimental]](figures/lifecycle-experimental.svg)
This function creates residual plots to diagnose model fit. It can display:
Residuals vs fitted values plots for individual models
Multiple residual plots when multiple models are selected
Customizable plot appearance through ggplot2
Arguments
- breg
A regression object with results (must pass
assert_breg_obj_with_results()).- idx
Index or names (focal variables) of the model(s). If
NULL(default), all models are included. If length-1, shows residuals for a single model. If length > 1, shows faceted plots for multiple models.- plot_type
Character string specifying the type of residual plot. Options: "fitted" (residuals vs fitted values, default), "qq" (Q-Q plot), "scale_location" (scale-location plot).
Examples
m <- br_pipeline(mtcars,
y = "mpg",
x = colnames(mtcars)[2:4],
x2 = "vs",
method = "gaussian"
)
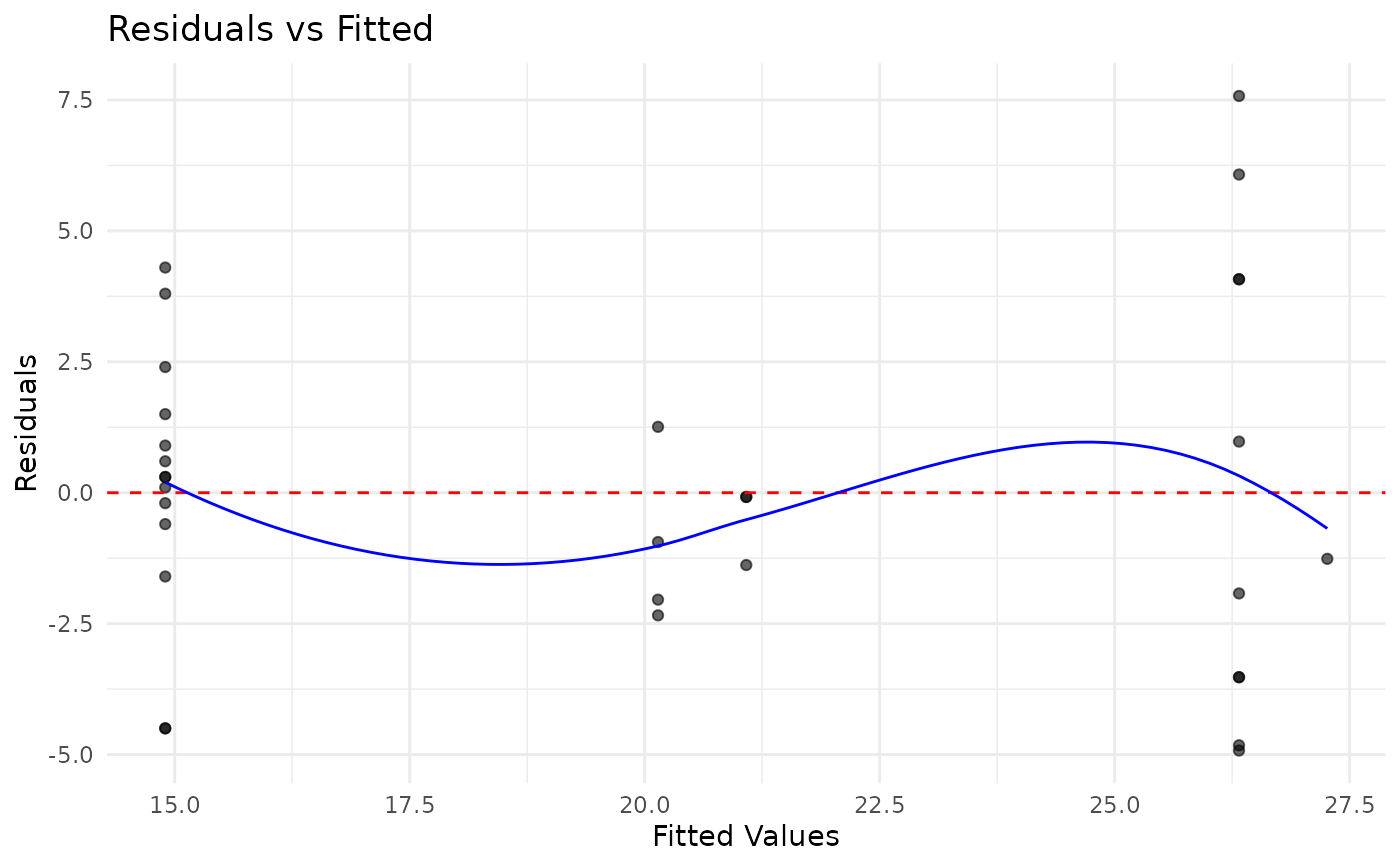
# Single model residual plot
br_show_residuals(m, idx = 1)
#> `geom_smooth()` using formula = 'y ~ x'
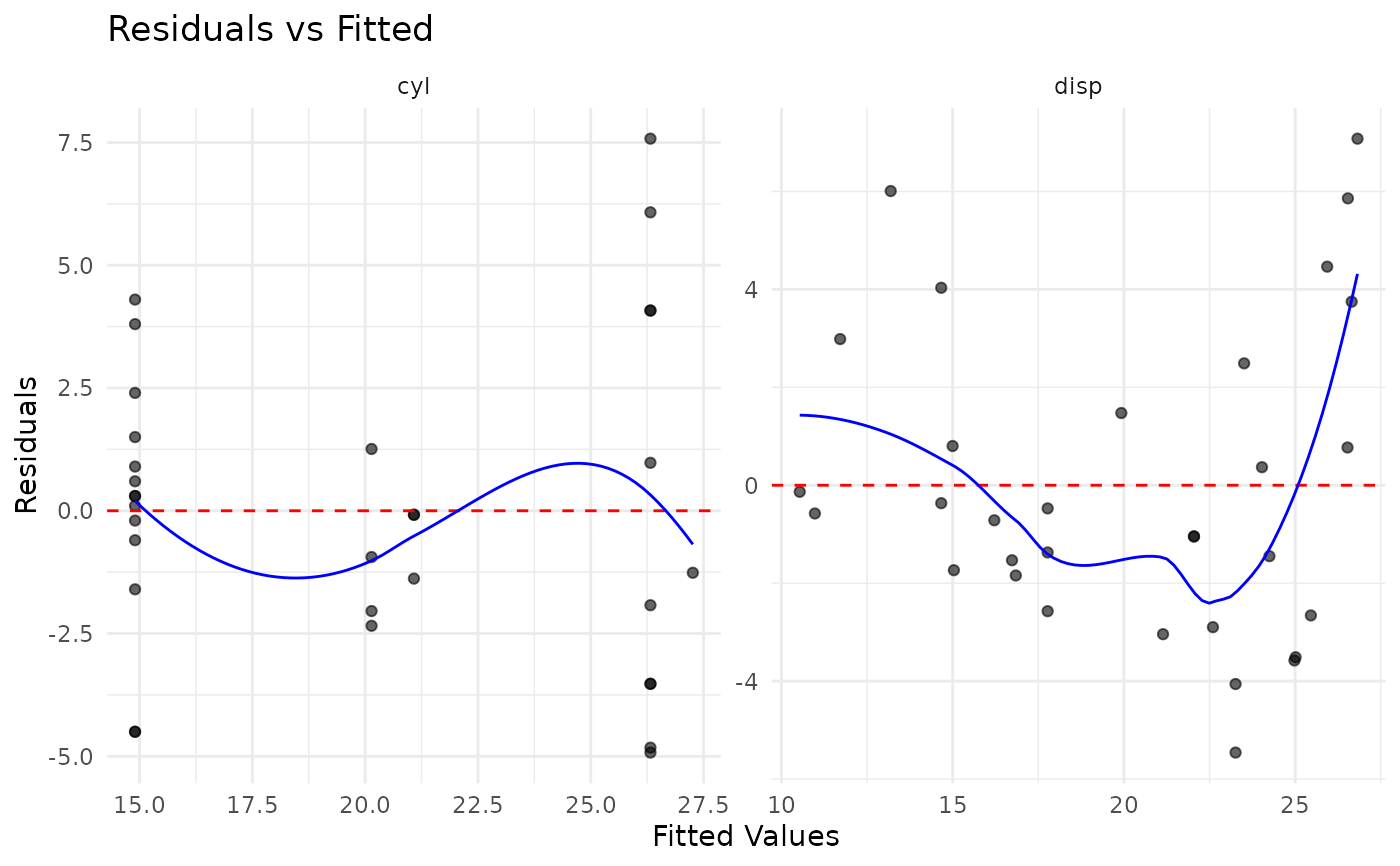
 # Multiple models
br_show_residuals(m, idx = c(1, 2))
#> `geom_smooth()` using formula = 'y ~ x'
# Multiple models
br_show_residuals(m, idx = c(1, 2))
#> `geom_smooth()` using formula = 'y ~ x'
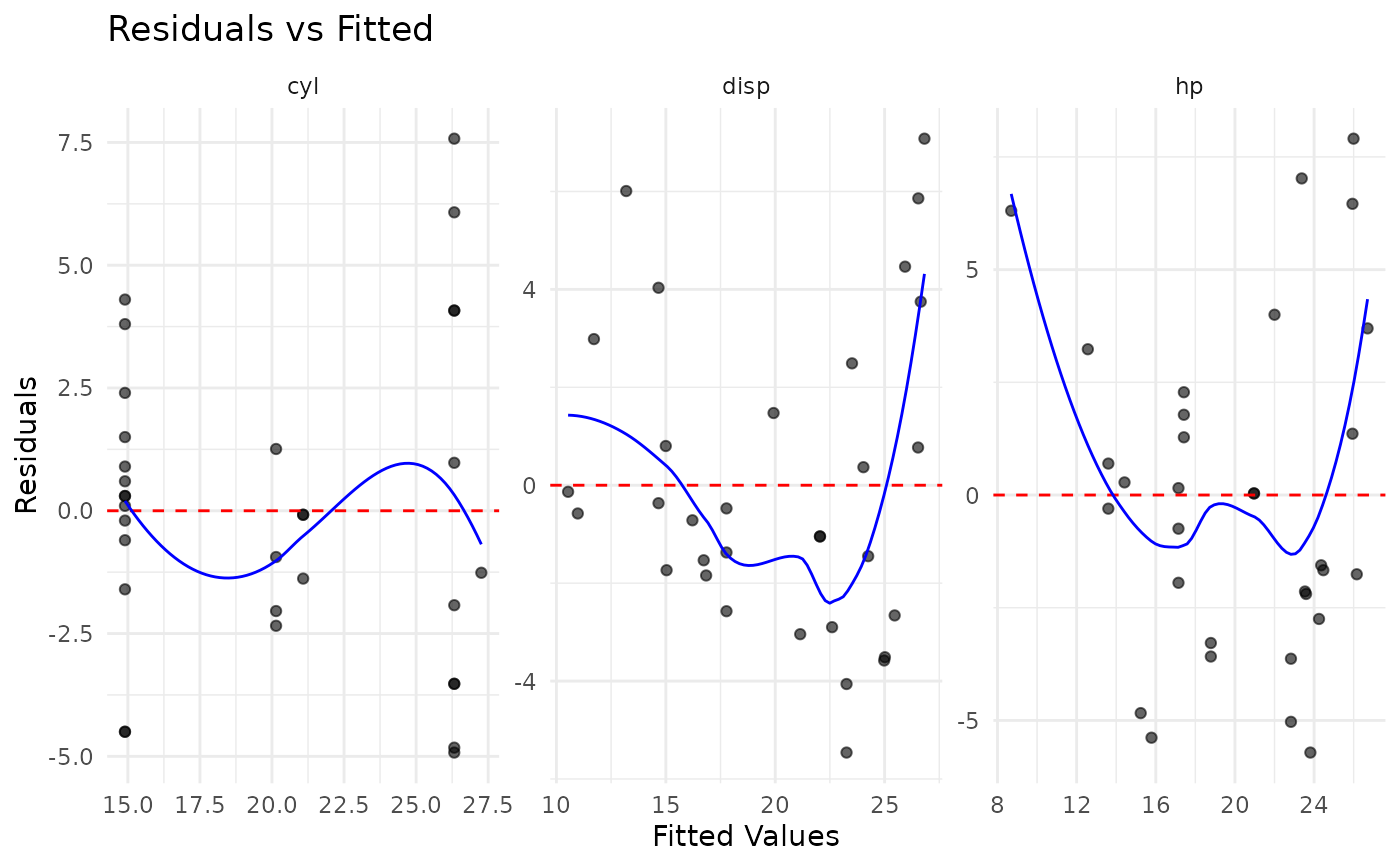
 # All models
br_show_residuals(m)
#> `geom_smooth()` using formula = 'y ~ x'
# All models
br_show_residuals(m)
#> `geom_smooth()` using formula = 'y ~ x'