![[Stable]](figures/lifecycle-stable.svg)
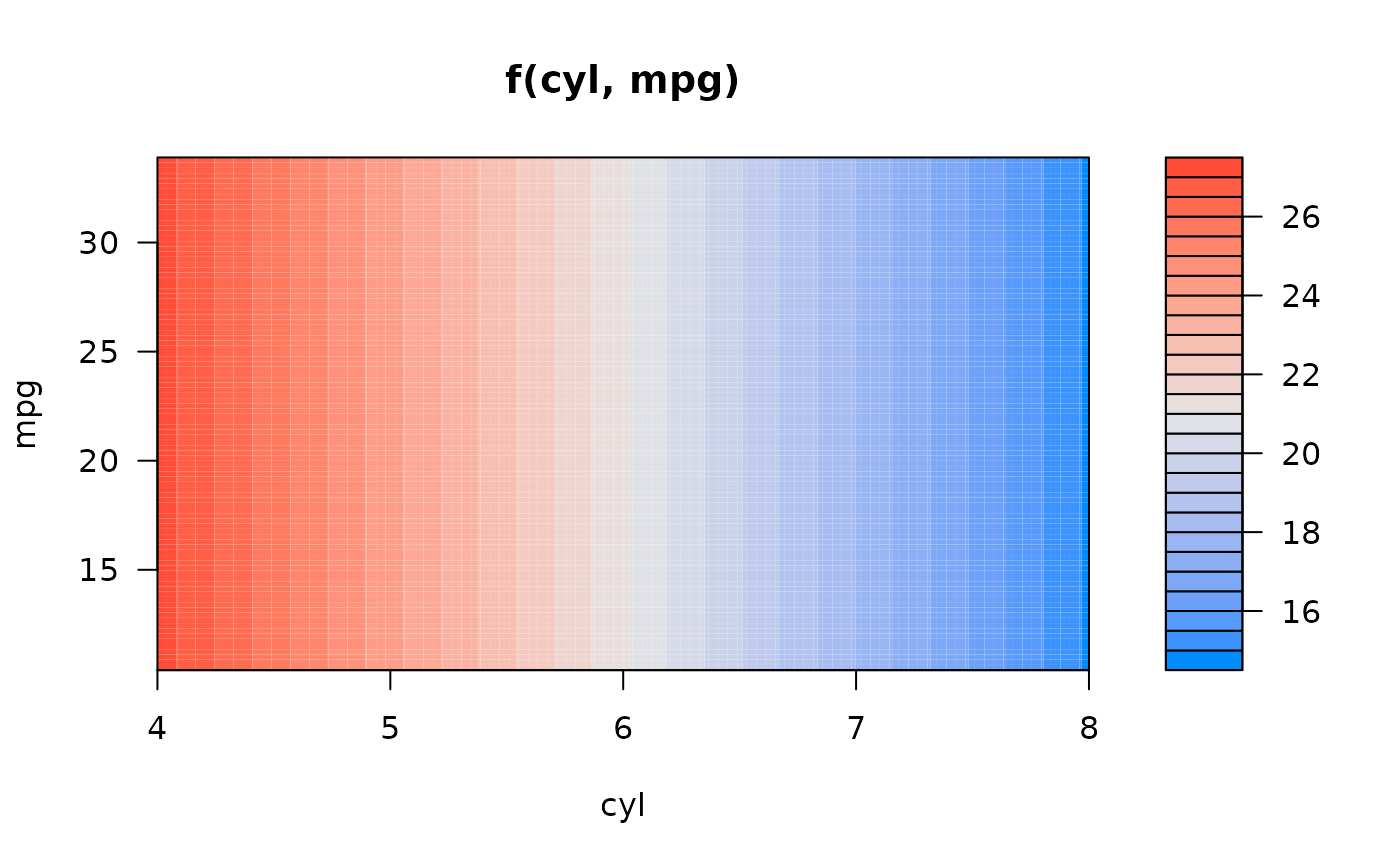
Similar to br_show_fitted_line(), but visualize how two variables interact to affect the response in regression models.
Arguments
- breg
A regression object with results (must pass
assert_breg_obj_with_results()).- idx
Length-1 vector. Index or name (focal variable) of the model. This is different from
idxin br_show_forest_ggstats, only one model is supported to visualized here, so only length-1 vector is supported asidx.- ...
Arguments passing to
visreg::visreg2d()exceptsfitanddata.
Examples
if (rlang::is_installed("visreg")) {
  m <- br_pipeline(mtcars,
    y = "mpg",
    x = colnames(mtcars)[2:4],
    x2 = "vs",
    method = "gaussian"
  )

  br_show_fitted_line_2d(m, xvar = "cyl", yvar = "mpg")
}
#> model call: stats::glm(formula = mpg ~ cyl + vs, family = stats::gaussian, data
#> = data)