![[Experimental]](figures/lifecycle-experimental.svg)
This function creates a circular (polar) forest plot from regression results,
providing an alternative visualization to the traditional linear forest plot.
The function uses the same input as br_show_forest() but displays the results
in a circular format using ggplot2::coord_polar().
Arguments
- breg
A regression object with results.
- rm_controls
If
TRUE, remove control terms.- style
Character string specifying the style of circular forest plot. Options are:
"points"(default): Display point estimates with error bars in circular format"bars": Display as bars with points overlaid
- ref_line
Logical or numeric. If
TRUE, shows reference circle at default value (1 for exponentiated estimates, 0 for regular estimates). If numeric, shows reference circle at specified value. IfFALSE, no reference circle is shown.- sort_by
Character string specifying how to sort the variables. Options are:
"none"(default): No sorting, use original order"estimate": Sort by effect estimate (ascending)"estimate_desc": Sort by effect estimate (descending)"pvalue": Sort by p-value (ascending, most significant first)"variable": Sort alphabetically by variable name
- subset
Expression for subsetting the results data (
br_get_results(breg)).- log_first
Log transformed the estimates and their confident intervals.
Examples
m <- br_pipeline(mtcars,
y = "mpg",
x = colnames(mtcars)[2:4],
x2 = "vs",
method = "gaussian"
)
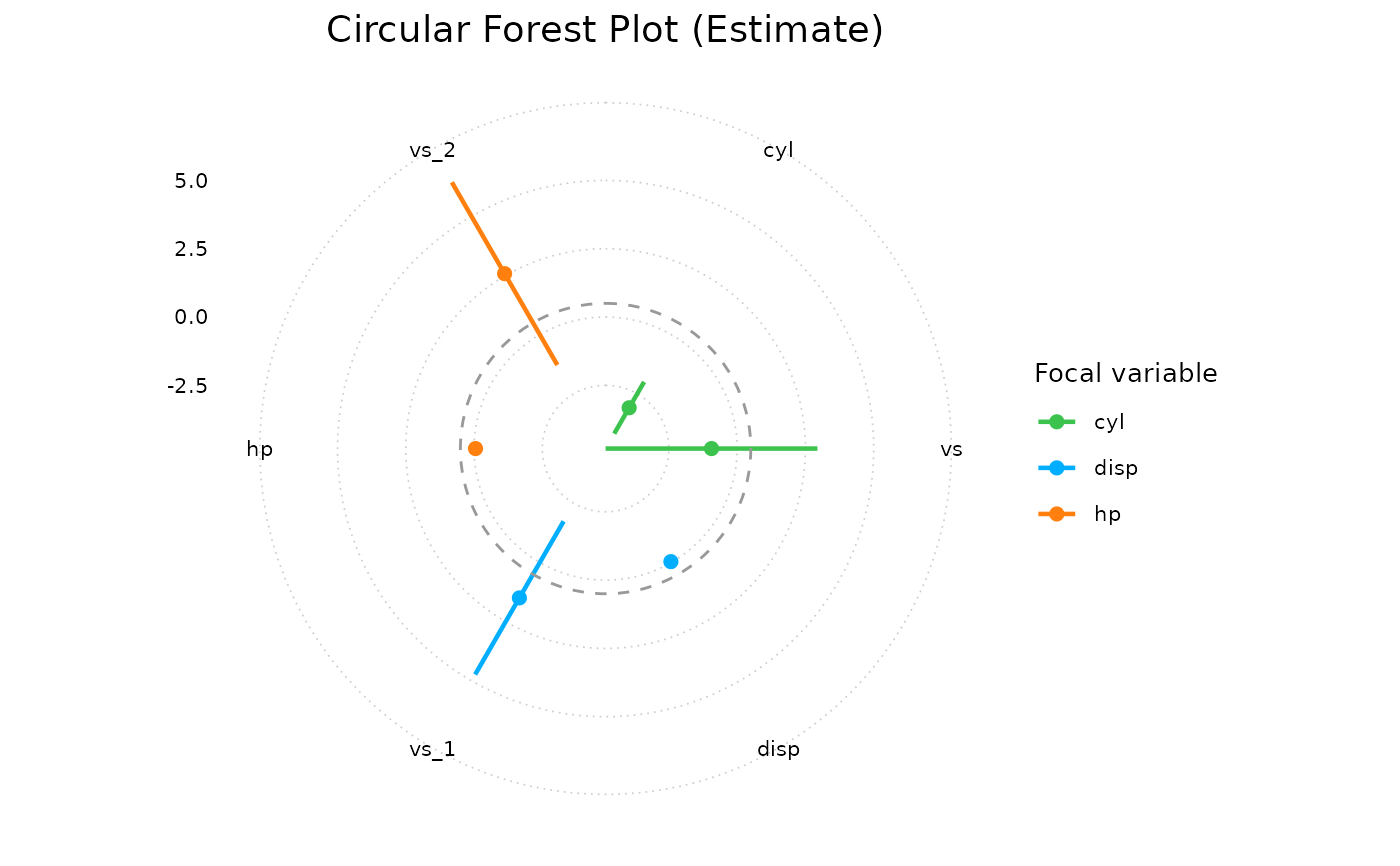
br_show_forest_circle(m)
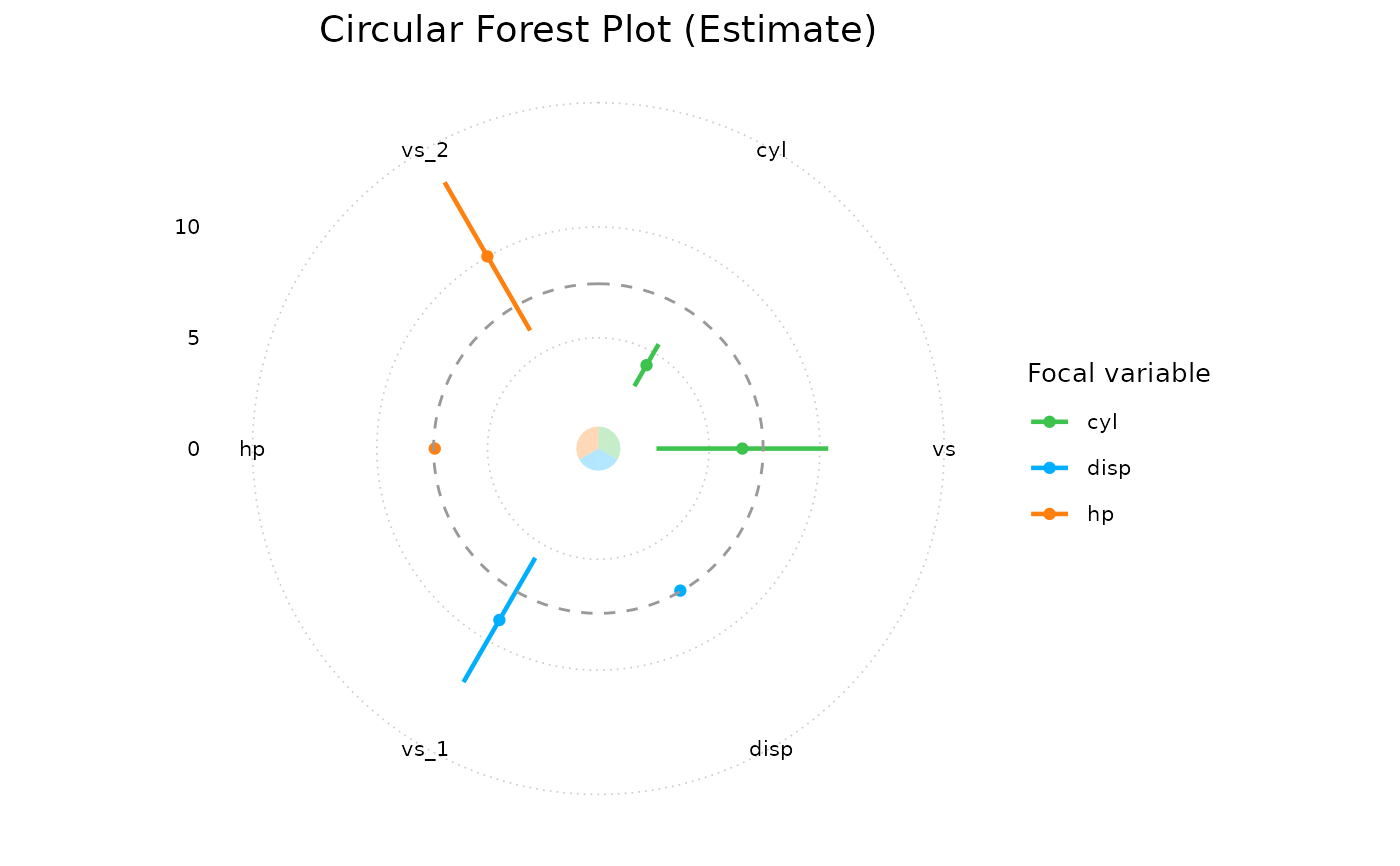
 br_show_forest_circle(m, style = "bars")
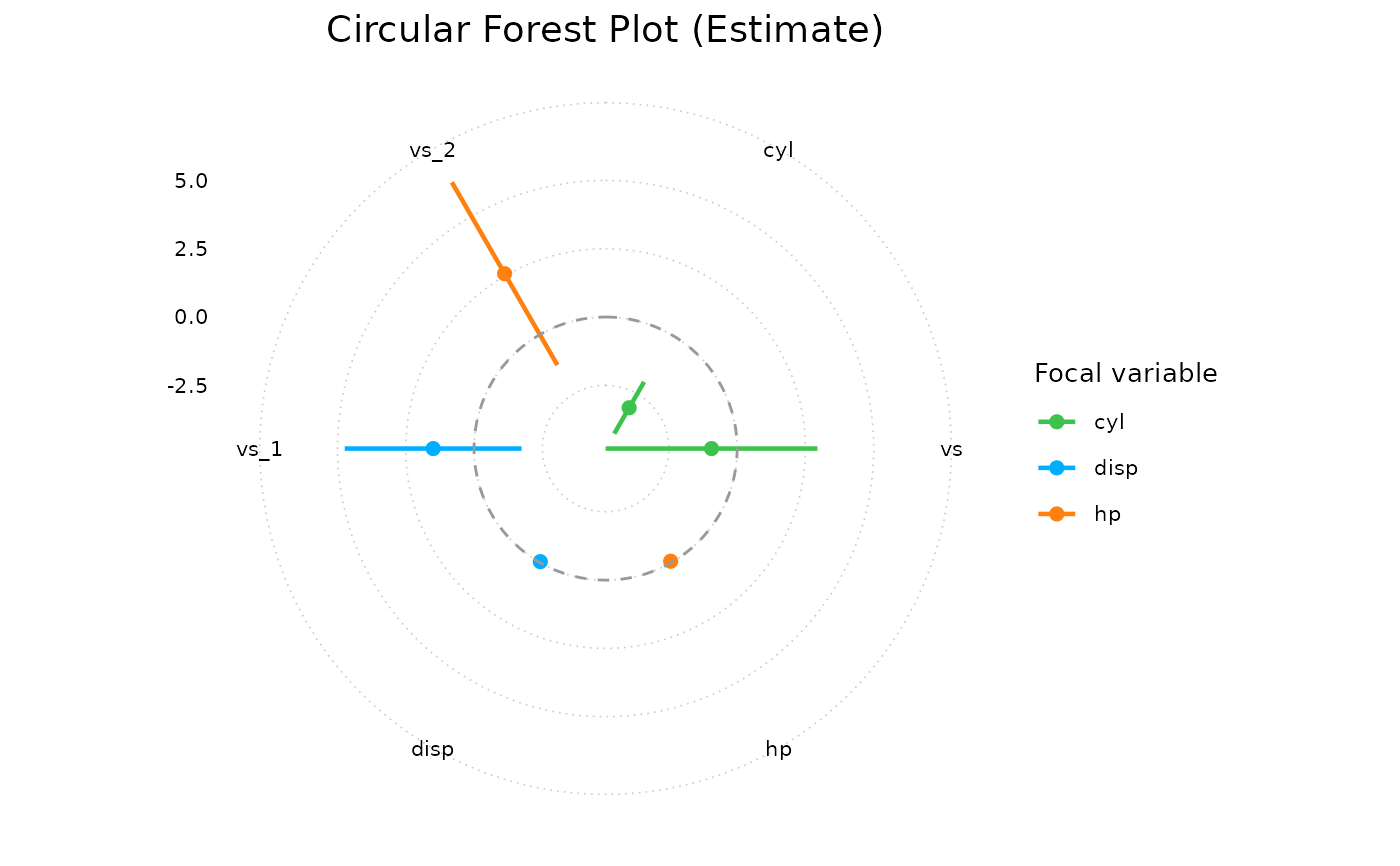
 br_show_forest_circle(m, sort_by = "estimate")
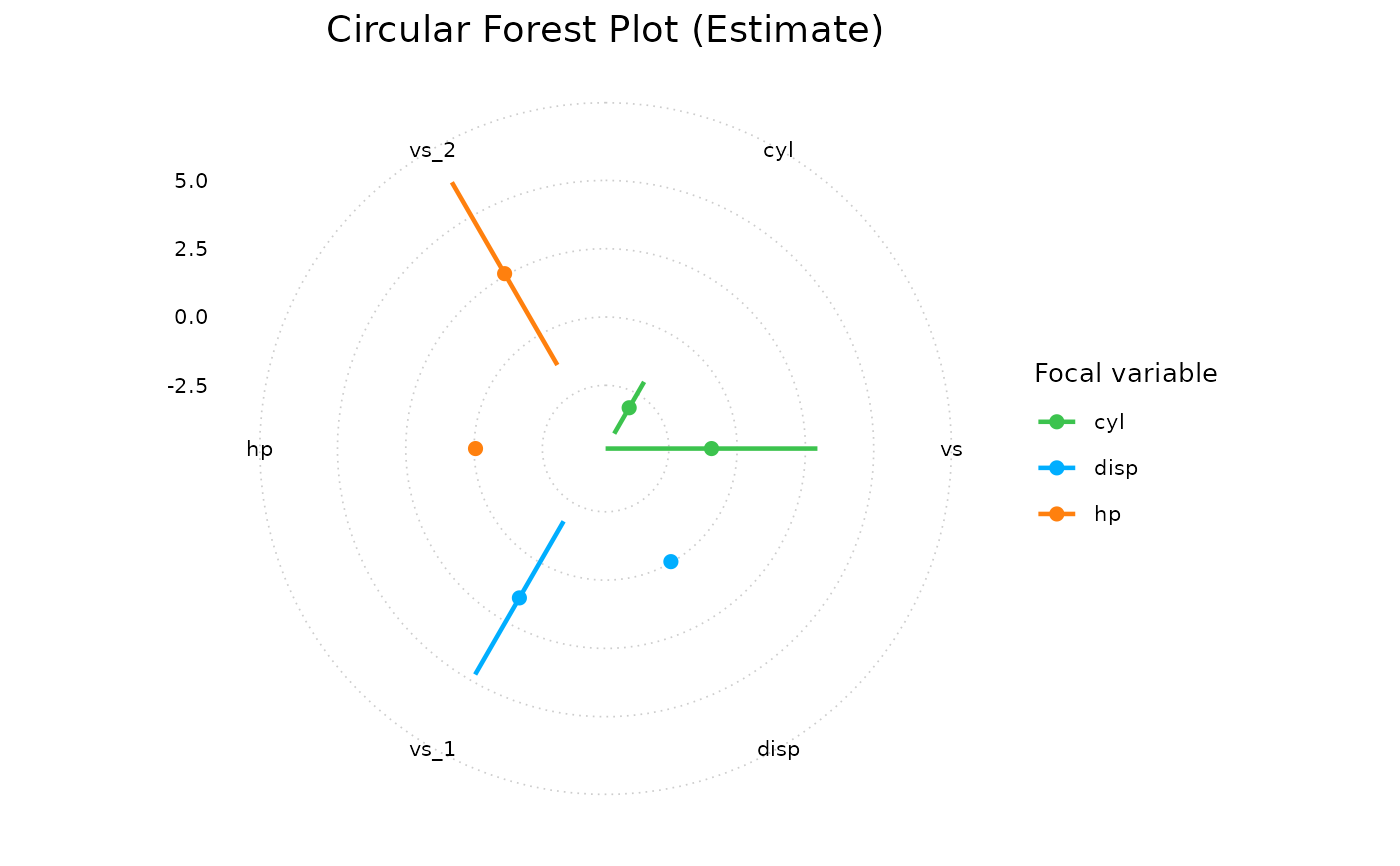
 br_show_forest_circle(m, ref_line = FALSE)
 br_show_forest_circle(m, ref_line = 0.5)