Show Cox proportional hazards model diagnostic plots
Source:R/04-show.R
br_show_coxph_diagnostics.Rd![[Experimental]](figures/lifecycle-experimental.svg)
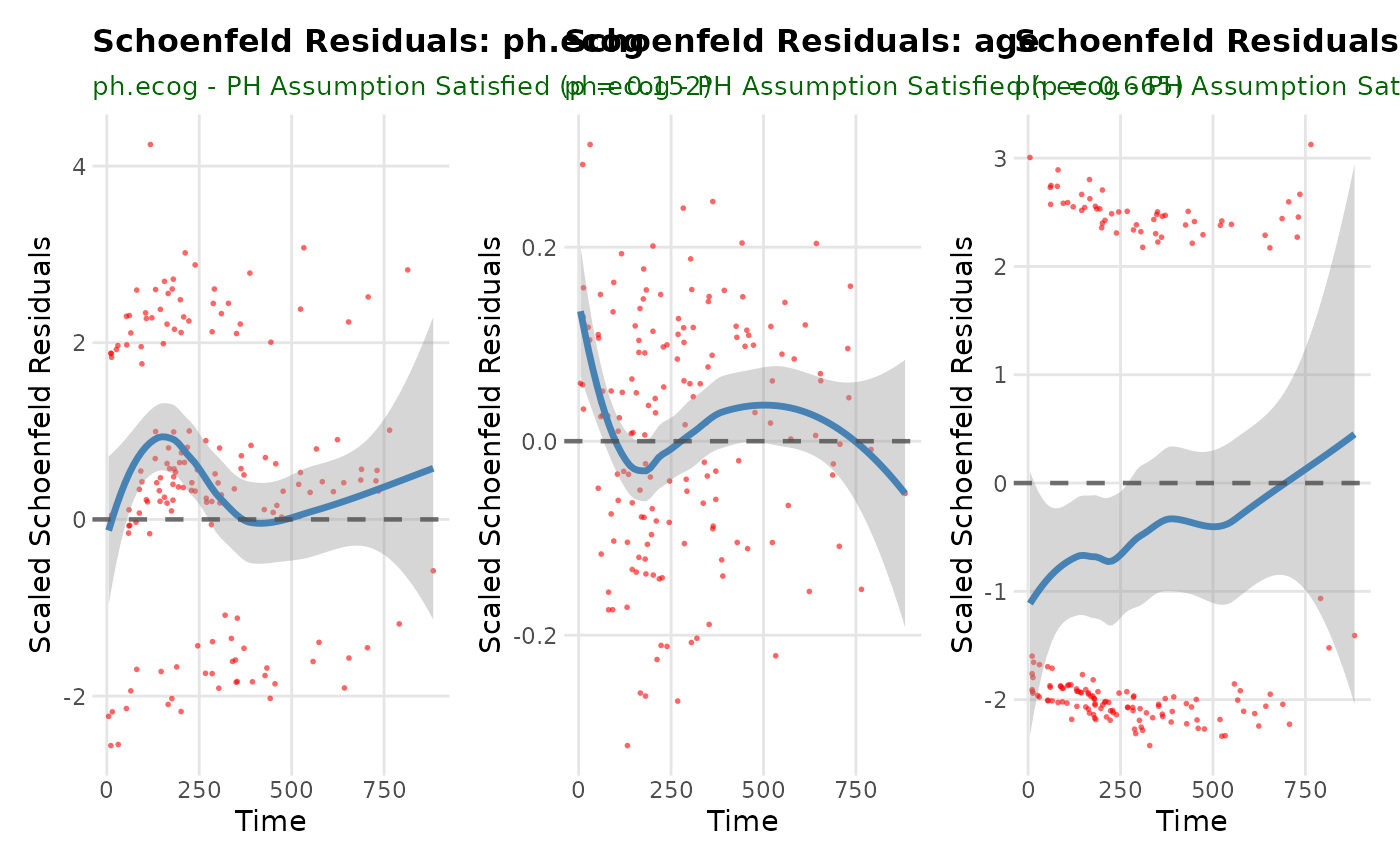
Creates diagnostic plots specifically for Cox regression models. Focuses on Schoenfeld residuals plots to assess proportional hazards assumption and other Cox-specific diagnostics. Inspired by survminer::ggcoxzph with enhanced visualization and computation optimizations to work in bregr.
Usage
br_show_coxph_diagnostics(
  breg,
  idx = 1,
  type = "schoenfeld",
  resid = TRUE,
  se = TRUE,
  point_col = "red",
  point_size = 1,
  point_alpha = 0.6,
  ...
)
Arguments
- breg
A regression object with results (must pass
assert_breg_obj_with_results()).- idx
Index or name (focal variable) of the Cox model to plot. Must be a single model.
- type
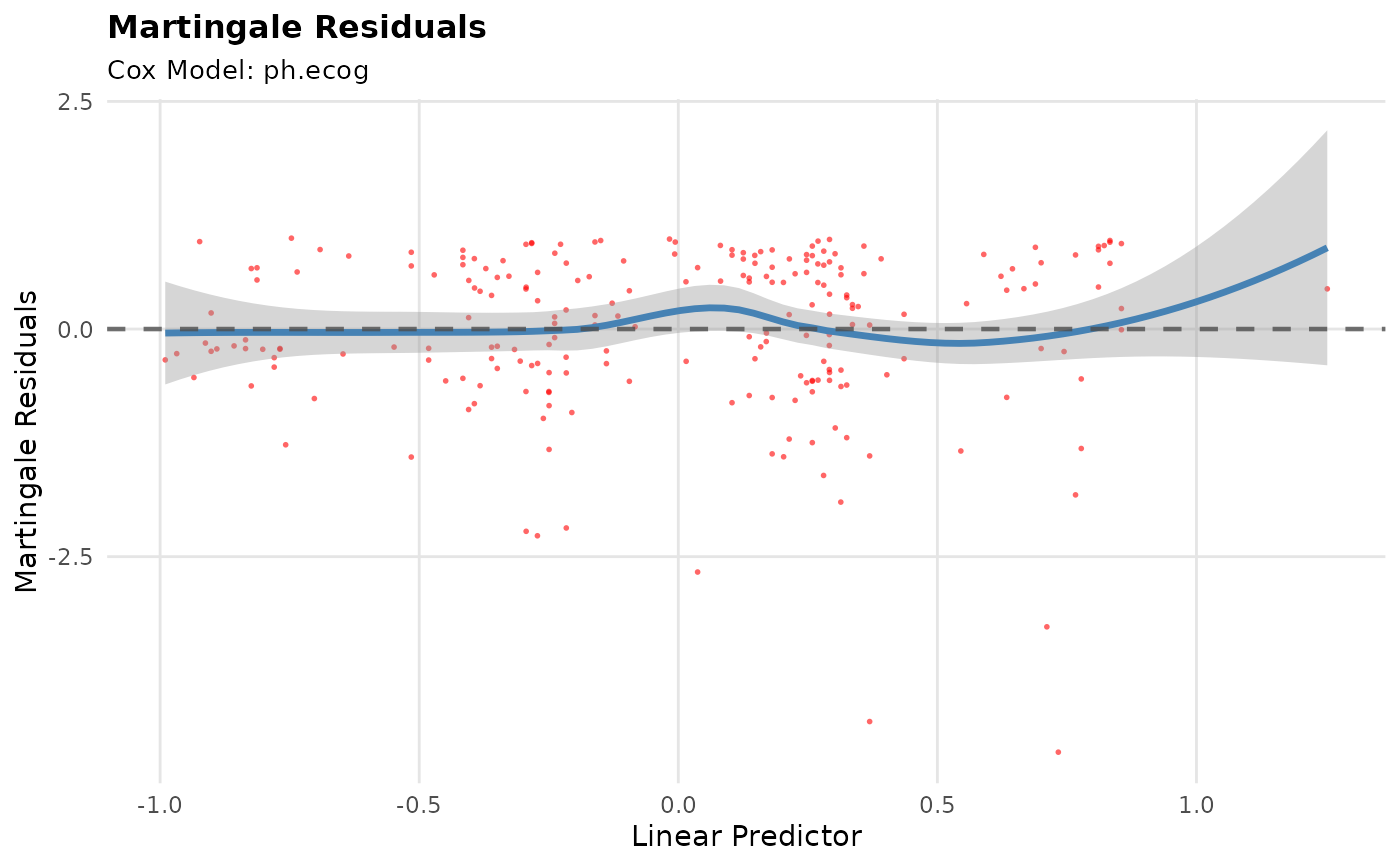
Type of Cox diagnostic plot. Options: "schoenfeld" (default for Schoenfeld residuals), "martingale" (martingale residuals), "deviance" (deviance residuals).
- resid
Logical, if TRUE the residuals are included on the plot along with smooth fit.
- se
Logical, if TRUE confidence bands at two standard errors will be added.
- point_col
Color for residual points.
- point_size
Size for residual points.
- point_alpha
Alpha (transparency) for residual points.
- ...
Additional arguments passed to survival::cox.zph.
Examples
# Create Cox models
mds <- br_pipeline(
  survival::lung,
  y = c("time", "status"),
  x = colnames(survival::lung)[6:10],
  x2 = c("age", "sex"),
  method = "coxph"
)
#> exponentiate estimates of model(s) constructed from coxph method at default

# Show Cox diagnostic plots
p1 <- br_show_coxph_diagnostics(mds, idx = 1)
p1
#> `geom_smooth()` using formula = 'y ~ x'
#> `geom_smooth()` using formula = 'y ~ x'
#> `geom_smooth()` using formula = 'y ~ x'

p2 <- br_show_coxph_diagnostics(mds, type = "martingale")
p2
#> `geom_smooth()` using formula = 'y ~ x'
p2 <- br_show_coxph_diagnostics(mds, type = "martingale")
p2
#> `geom_smooth()` using formula = 'y ~ x'