![[Experimental]](figures/lifecycle-experimental.svg)
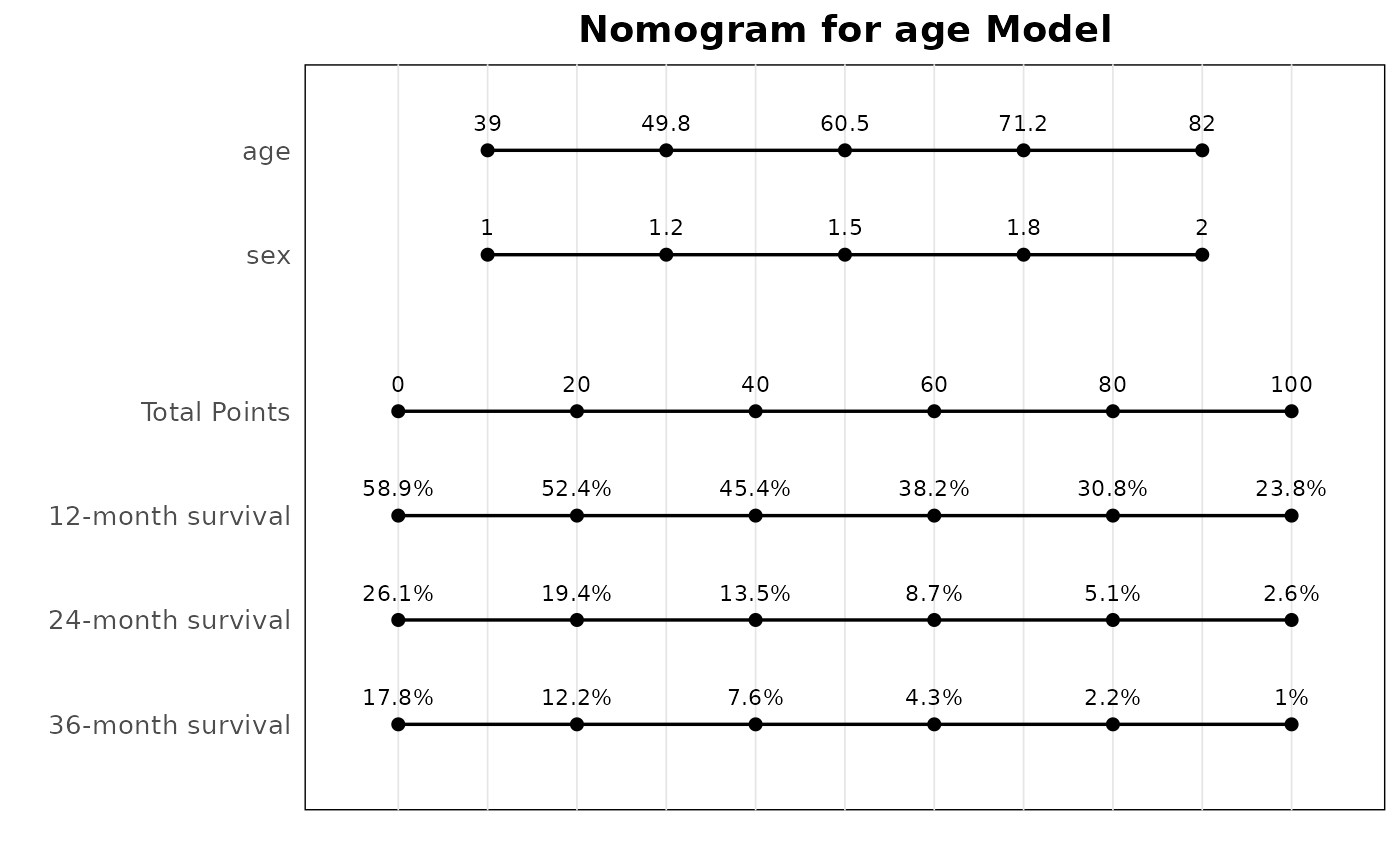
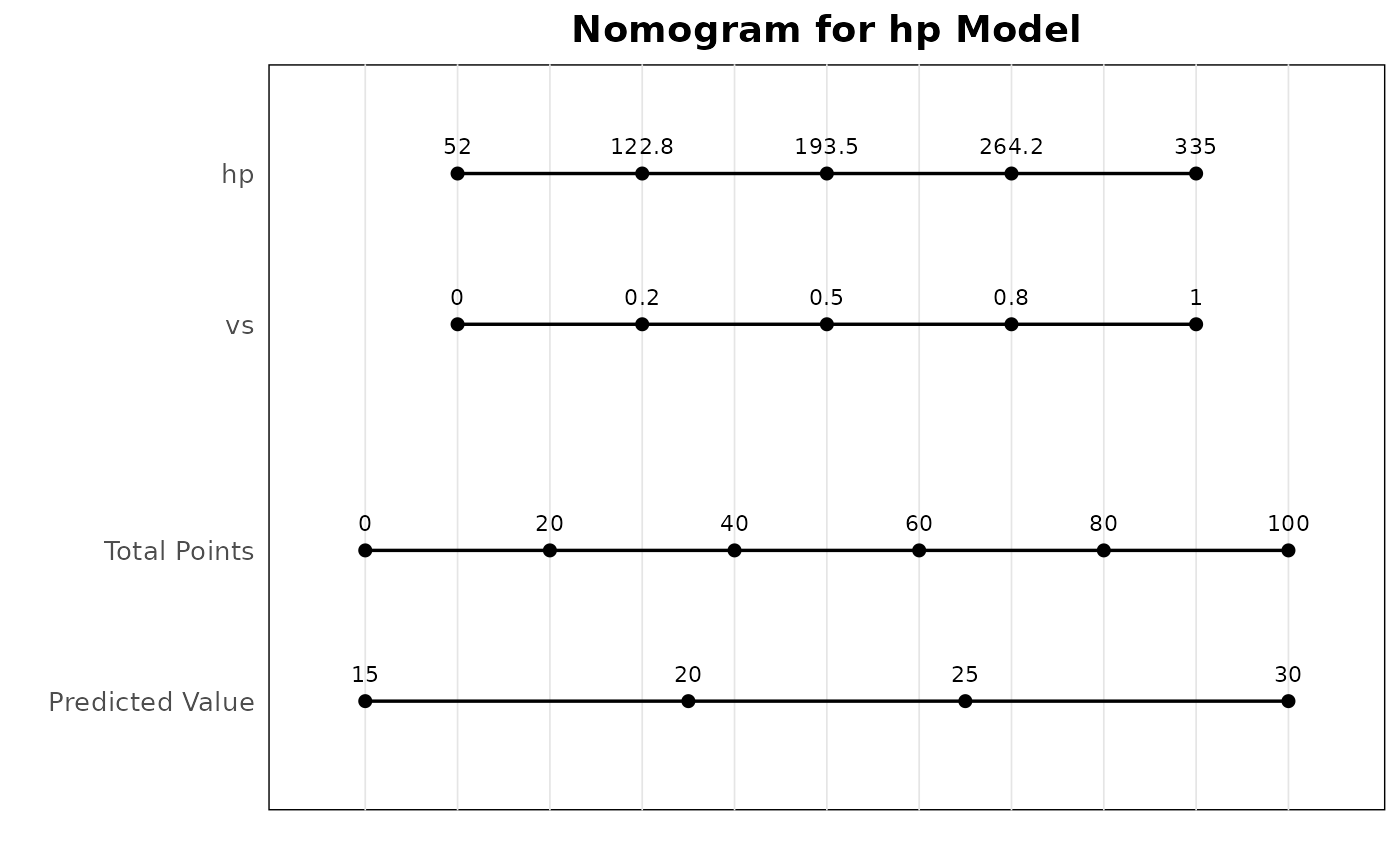
Creates a nomogram (graphical calculator) for regression models, particularly useful for Cox proportional hazards models. A nomogram allows visual calculation of predicted outcomes by assigning points to variable values and summing them to get total points that correspond to predicted probabilities.
Arguments
- breg
A
bregobject with fitted regression models.- idx
Index or name of the model to use for the nomogram. If NULL, uses the first model.
- time_points
For Cox models, time points at which to show survival probabilities. Default is c(12, 24, 36) representing months.
- fun_at
For non-survival models, the function values at which to show predictions.
- point_range
Range of points to use in the nomogram scale. Default is c(0, 100).
- title
Plot title. If NULL, generates automatic title.
- subtitle
Plot subtitle.
Examples
# \donttest{
# Cox regression nomogram
lung <- survival::lung |> dplyr::filter(ph.ecog != 3)
lung$ph.ecog <- factor(lung$ph.ecog)
mds <- br_pipeline(
lung,
y = c("time", "status"),
x = c("age", "ph.ecog"),
x2 = "sex",
method = "coxph"
)
#> exponentiate estimates of model(s) constructed from coxph method at default
p <- br_show_nomogram(mds)
#> `idx` not set, use the first model
#> Cox model: intercept term present but no intercept coefficient (as expected for
#> semi-parametric models)
p
 # Linear regression nomogram
mds_lm <- br_pipeline(
mtcars,
y = "mpg",
x = c("hp", "wt"),
x2 = "vs",
method = "gaussian"
)
p2 <- br_show_nomogram(mds_lm, fun_at = c(15, 20, 25, 30))
#> `idx` not set, use the first model
p2
# Linear regression nomogram
mds_lm <- br_pipeline(
mtcars,
y = "mpg",
x = c("hp", "wt"),
x2 = "vs",
method = "gaussian"
)
p2 <- br_show_nomogram(mds_lm, fun_at = c(15, 20, 25, 30))
#> `idx` not set, use the first model
p2
 # }
# }