Every plotting face of the package on one page, organized by the
question each figure answers. One small simulated cohort drives the
whole gallery: the setup block draws it with ms_simulate(),
then runs the fast faces – ms_fit() for reference
exposures, ms_extract() for de-novo signatures, plus the
bootstrap, stratification, embedding and QC surfaces – so every figure
below reuses the same MsCatalog, MsSignature
and MsFit objects. The variant-to-catalog face
(ms_tally()) is not needed here; it is covered in get-started.html. Each example opens with
the situation the figure is for; all faces return ggplot objects, so
anything shown can be re-themed or extended with the usual ggplot2
layers.
One cohort for the whole gallery
The dictionary is sliced from the bundled COSMIC reference face, whose matrices already carry the canonical SBS96 channel labels.
refdb <- ms_refdb_bundled(build = "GRCh38")
#> ms_refdb_bundled: no official ID reference set for build GRCh38 -- serving the declared build-independent set (nearest official build(s): GRCh37)
sbs <- refdb[["SBS_GRCh38"]]@matrices[[1]]
dict <- sbs[, c("SBS1", "SBS5", "SBS13", "SBS57")]
The cohort plants a clock-like pair everywhere, an APOBEC signature in a subgroup, the artifact signature SBS57 in another subgroup, and one deliberately hypermutated member that rides a count-scale exposure column instead of a share column.
samples <- c(paste0("T", 1:12), "H1")
act <- matrix(0, nrow = ncol(dict), ncol = length(samples),
              dimnames = list(colnames(dict), samples))
act["SBS1", samples[1:12]] <- 0.50
act["SBS5", samples[1:12]] <- 0.42
act["SBS13", c("T1", "T2", "T3", "T4")] <- 0.08
act["SBS57", c("T5", "T6")] <- 0.08
resid <- 1 - colSums(act[, samples[1:12]])
act["SBS1", samples[1:12]] <- act["SBS1", samples[1:12]] + resid / 2
act["SBS5", samples[1:12]] <- act["SBS5", samples[1:12]] + resid / 2
act["SBS1", "H1"] <- 12500
act["SBS5", "H1"] <- 10000
act["SBS13", "H1"] <- 2500
cat <- ms_simulate(dict, act, burden = 600, seed = 14)
cat
#> <MsCatalog> SBS96: 96 channels x 13 samples
The reused objects, all at minimal settings so the page renders
quickly (the de-novo face uses a single seeded NMF engine;
ms_extract()’s default consensus pipeline and the
bootstrap’s default replicate count are the thorough settings for real
analyses).
fit <- ms_fit(cat, dict)
sig <- ms_extract(cat, k = 3, method = "nmf")
boot <- ms_fit_bootstrap(cat, dict, method = "nnls", n_boot = 50, seed = 1,
                         return_draws = TRUE)
strat <- ms_stratify_hypermutants(cat, seed = 1)
emb <- ms_embed(fit@exposures, method = "kmeans", clusters = 2L, seed = 1)
qc <- ms_qc_report(cat, dict, fit@exposures)
roster <- ms_qc_roster_share(cat, dict, fit@exposures)
Catalog and signature profiles
plot_catalog_profile() is for rendering a single profile
column – one catalog sample or one signature – in the COSMIC bar style,
with the substitution classes colored and the flanking-context labels
vertical.
plot_catalog_profile(cat@counts, column = "T1")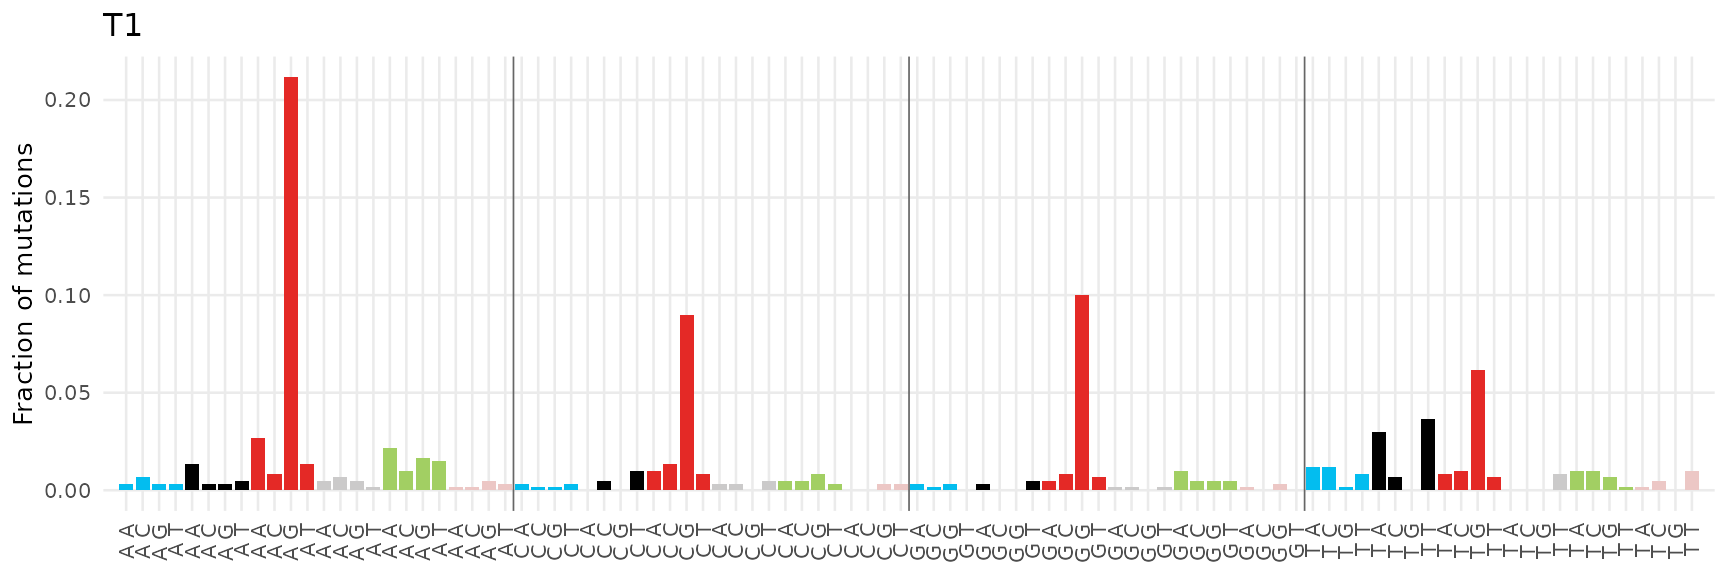
In mode = "count" the y axis carries raw mutations
instead of shares – the natural reading for a burden outlier such as the
hypermutated member.
plot_catalog_profile(cat@counts, column = "H1", mode = "count")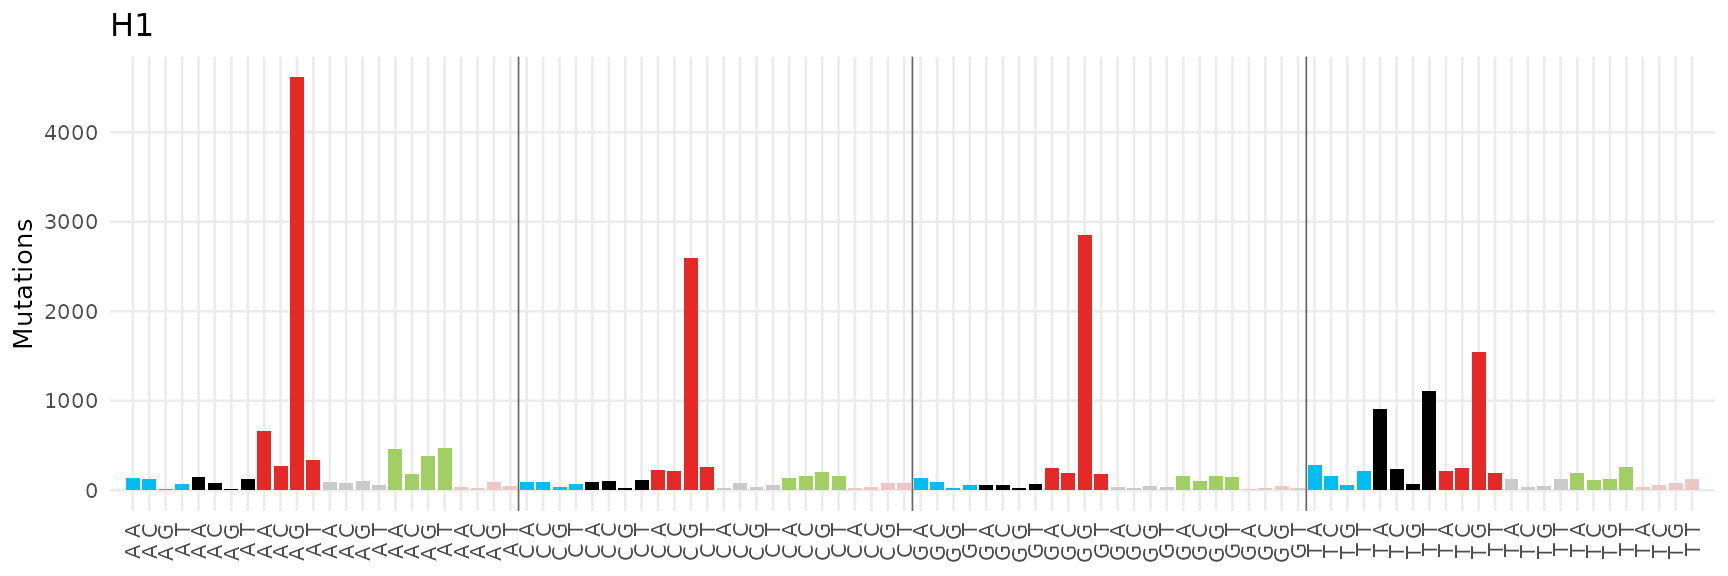
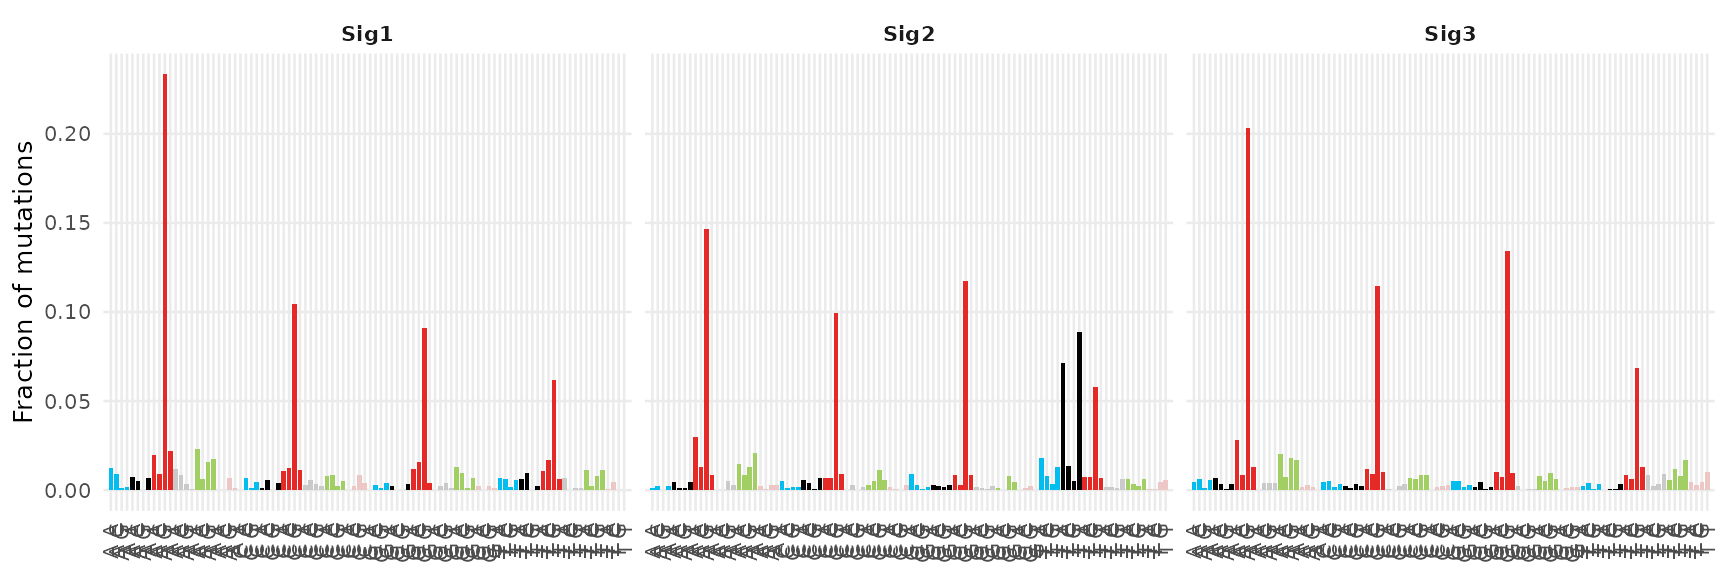
plot_signature_catalog() is for inspecting a whole
signature set at once: the same semantics, one panel per signature. It
accepts a matrix or an MsSignature directly.
Reference comparison
plot_cosmic_scatter() is for judging, channel by
channel, how an estimated profile lines up against a reference profile:
the identity line, the cosine, and an empirical signature-null tail
probability are annotated on the plot itself.
plot_cosmic_scatter(sig@signatures[, 1], dict[, "SBS1"], label = "SBS1")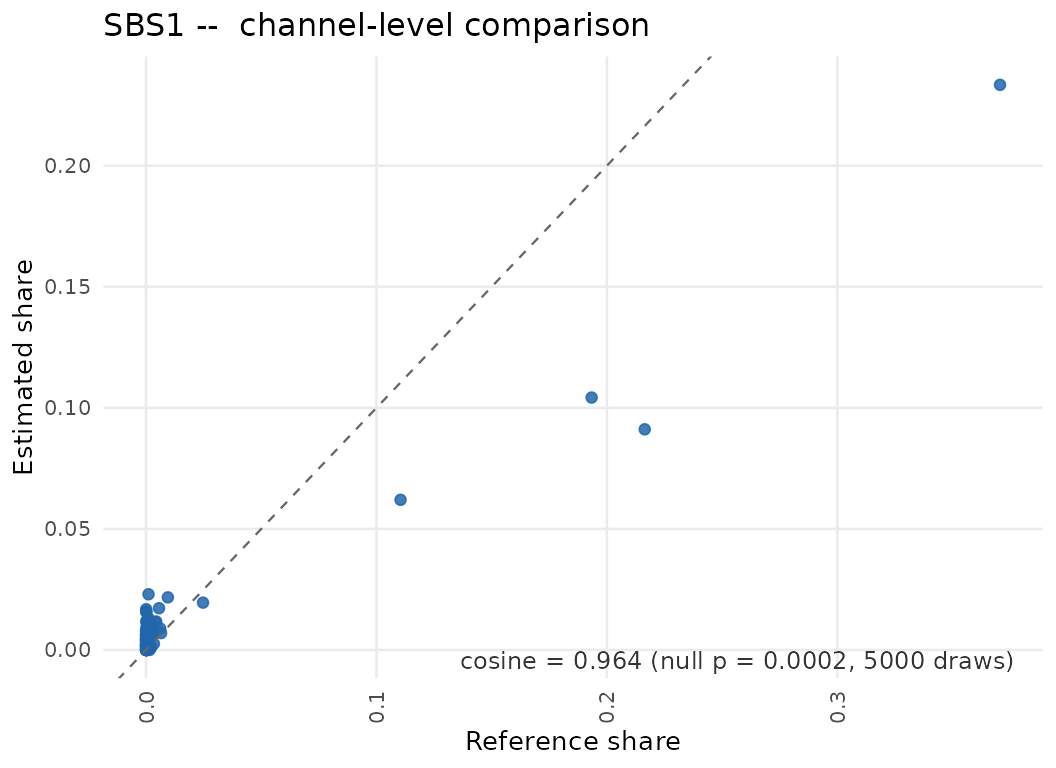
plot_reference_comparison() is for the same pairing when
the deviations matter more than the summary: the estimate is drawn dark
and the reference light, on shared axes.
plot_reference_comparison(sig@signatures[, 1], dict[, "SBS1"])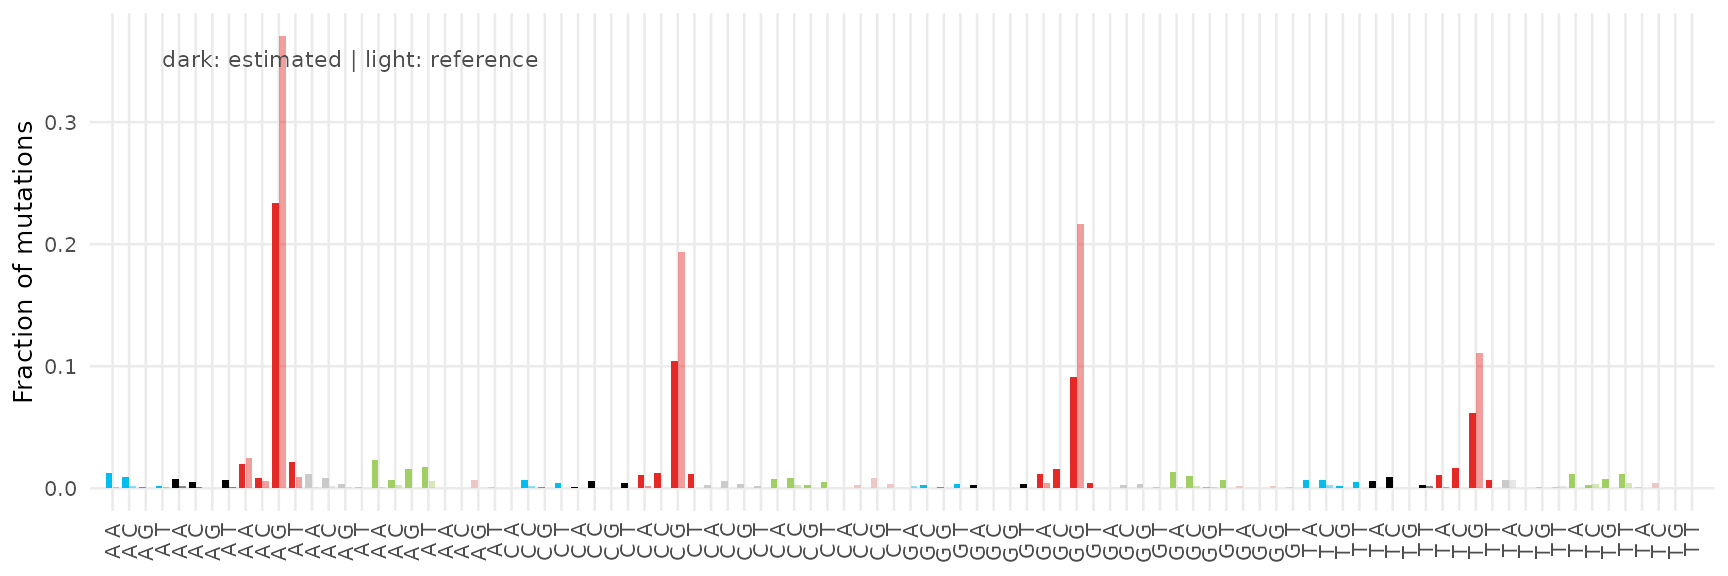
Exposure structure
plot_exposure_heatmap() is for reading the cohort-wide
exposure matrix at a glance, one row per sample; the exposure faces
accept the labelled matrix or an MsSignature.
plot_exposure_heatmap(fit@exposures)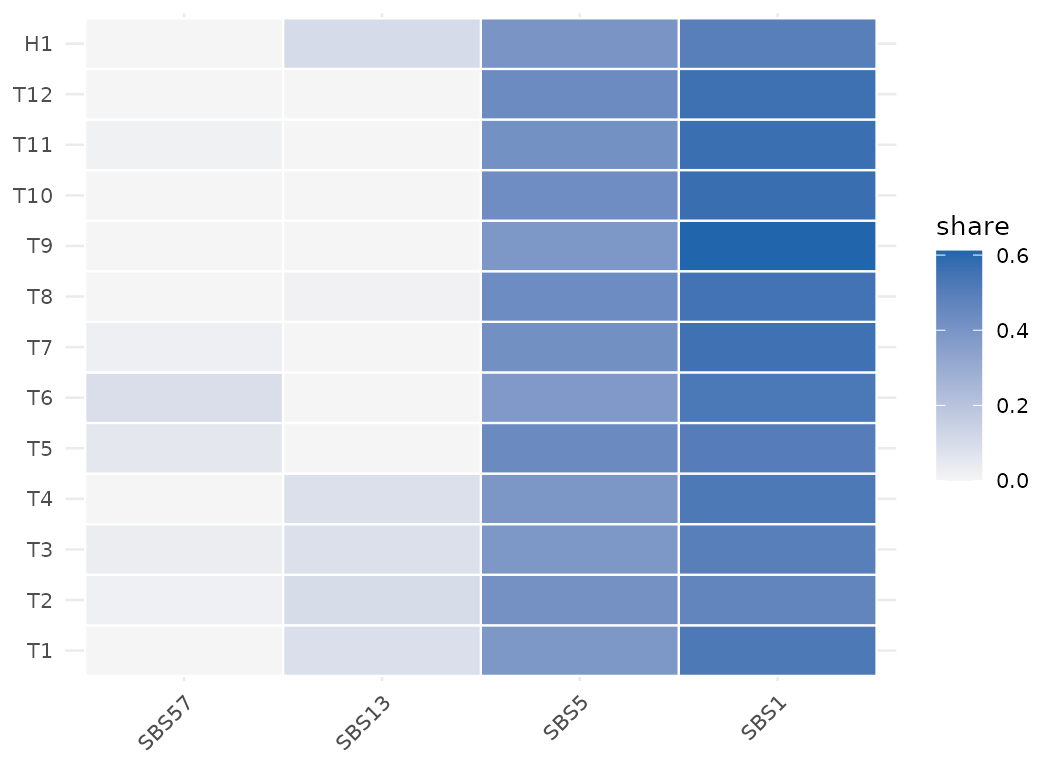
plot_exposure_stacked() is for the compositional story
per sample: one bar per sample, stacked by signature share.
plot_exposure_stacked(fit@exposures)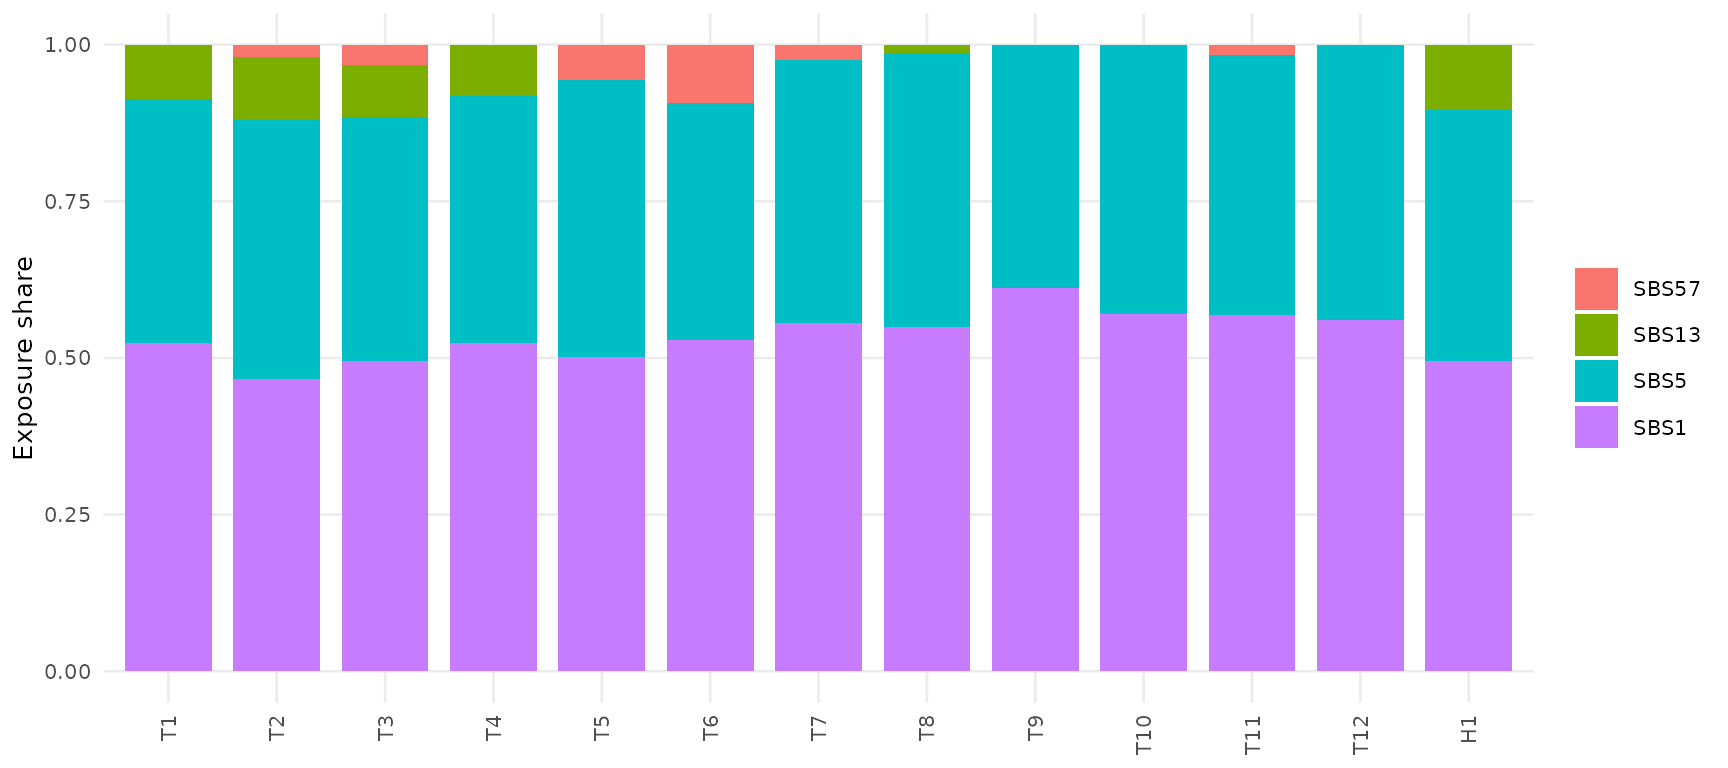
plot_exposure_riverplot() is for the same table read as
flows between the sample axis and the signature axis (requires the
ggalluvial package).
plot_exposure_riverplot(fit@exposures)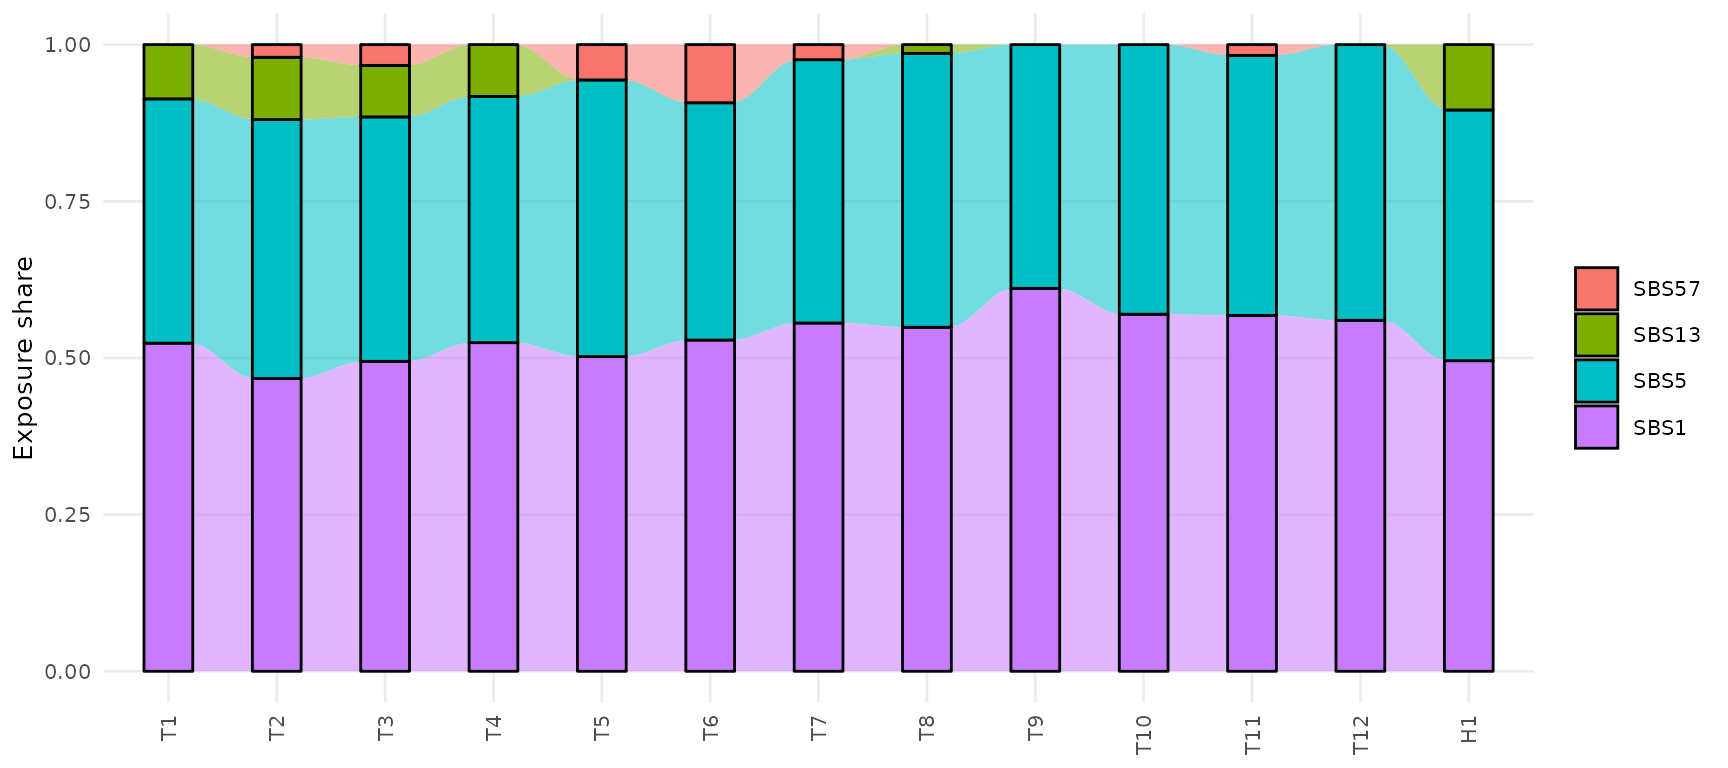
Evidence panels
plot_boot_ci() is for a single sample’s decomposition
with uncertainty bars: point exposures with their bootstrap percentile
whiskers, ordered by exposure share.
plot_boot_ci(boot, sample = "H1")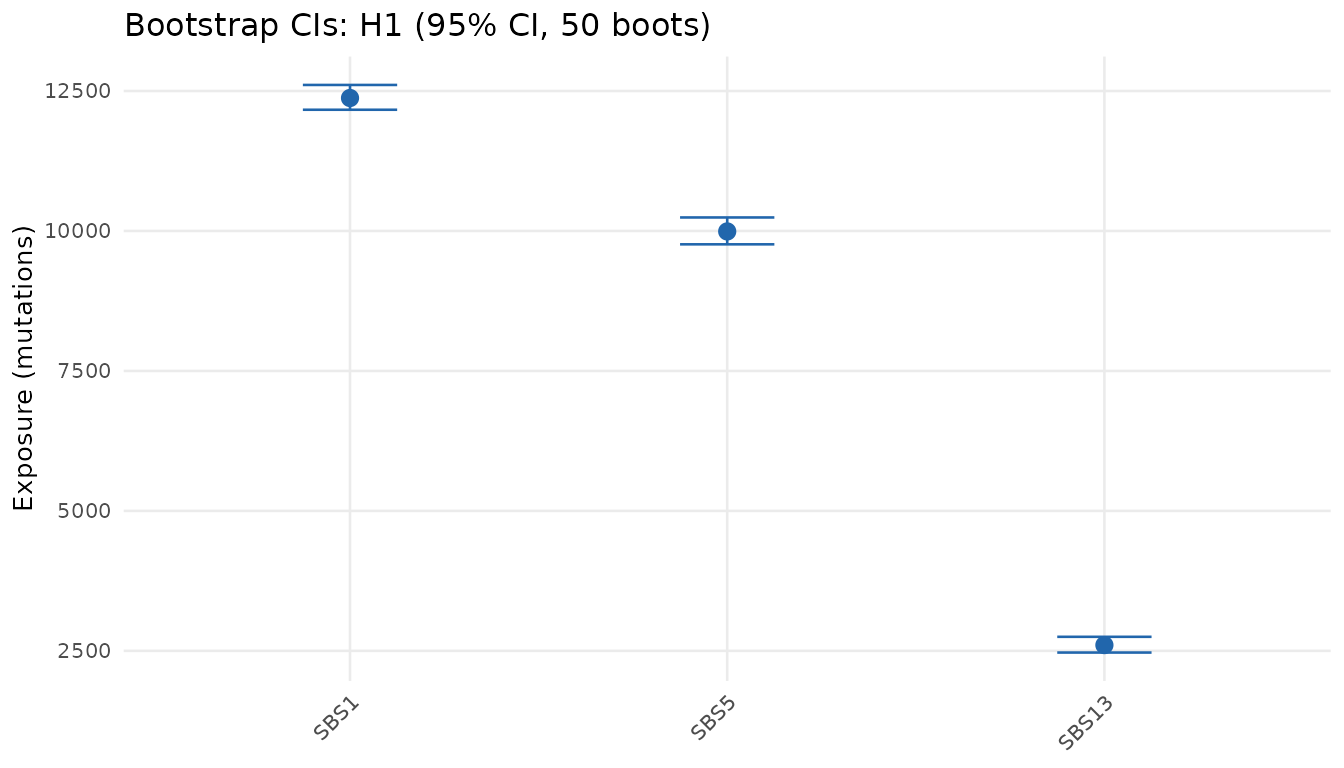
plot_boot_distribution() is for the shape of the
resampling evidence itself, not just the interval endpoints:
per-signature histograms of the raw boot draws, with the estimate and
both bounds marked (the fit must carry the draws cube, hence
return_draws = TRUE above).
plot_boot_distribution(boot, sample = "T1")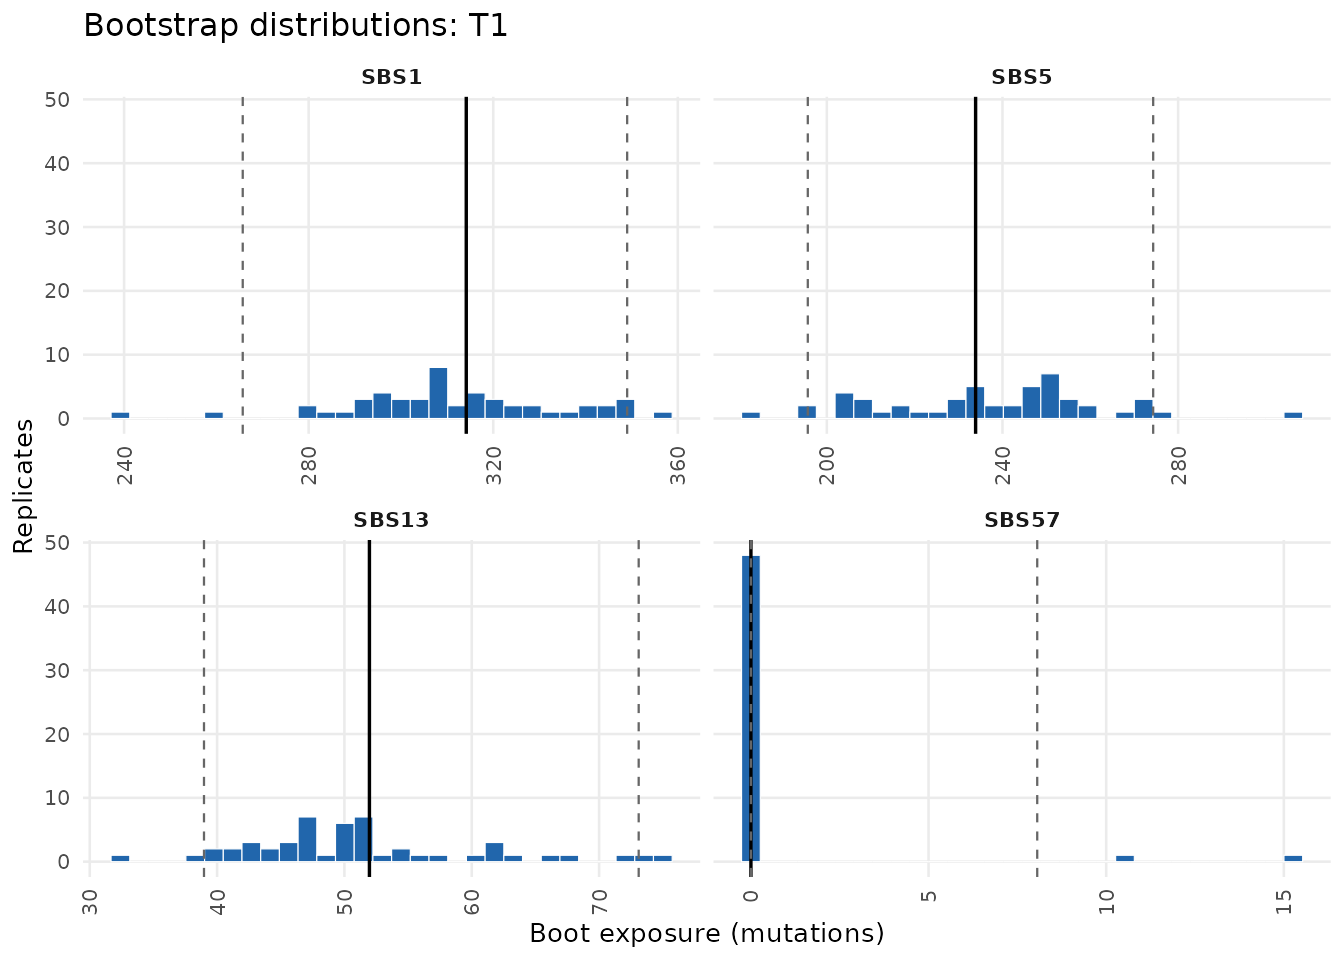
plot_hypermutator_burden() is for seeing who was flagged
as hypermutated: a burden histogram colored by the stored adjudication,
with the stored cutoff as a dashed line – nothing is re-thresholded at
plot time.
plot_hypermutator_burden(strat)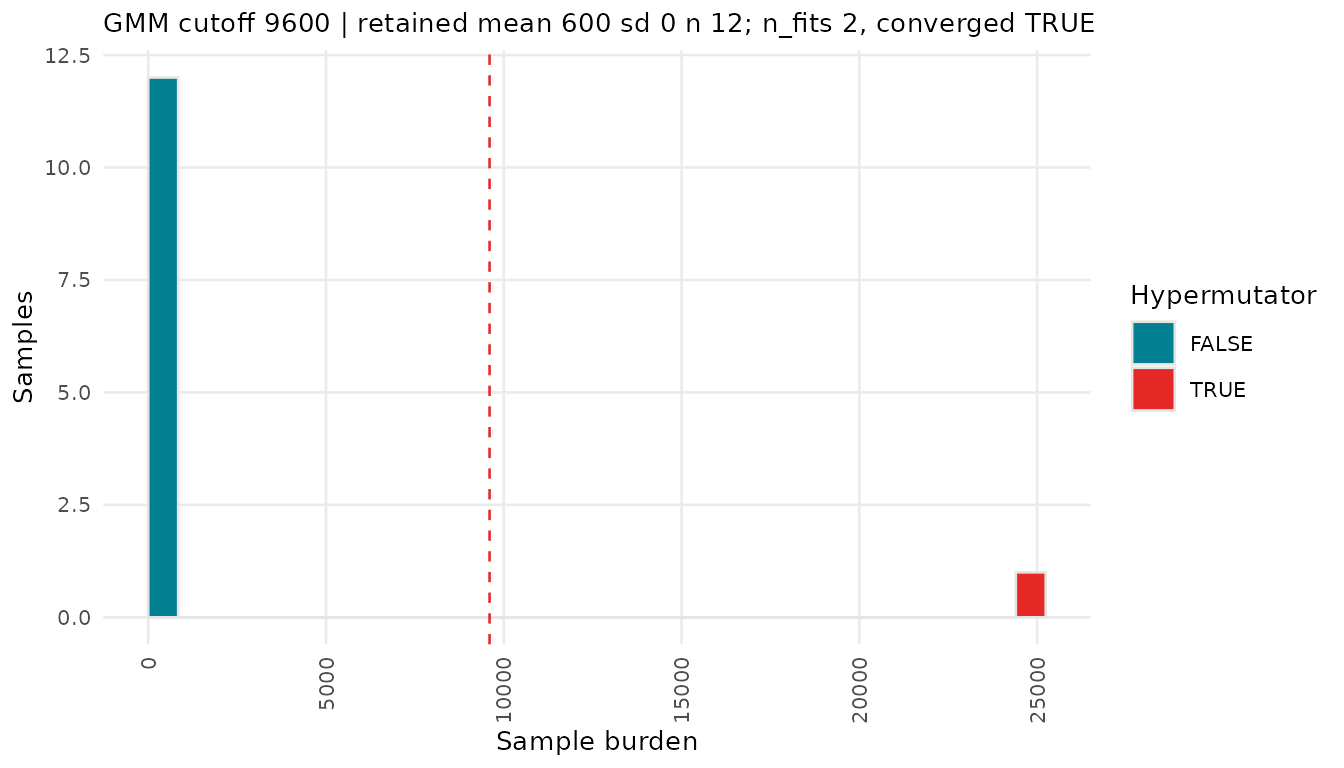
plot_embedding() is for seeing how samples organize in
exposure space; when the embedding table carries a cluster column the
points are colored by it.
plot_embedding(emb)
#> Ignoring unknown labels:
#> • colour : "cluster"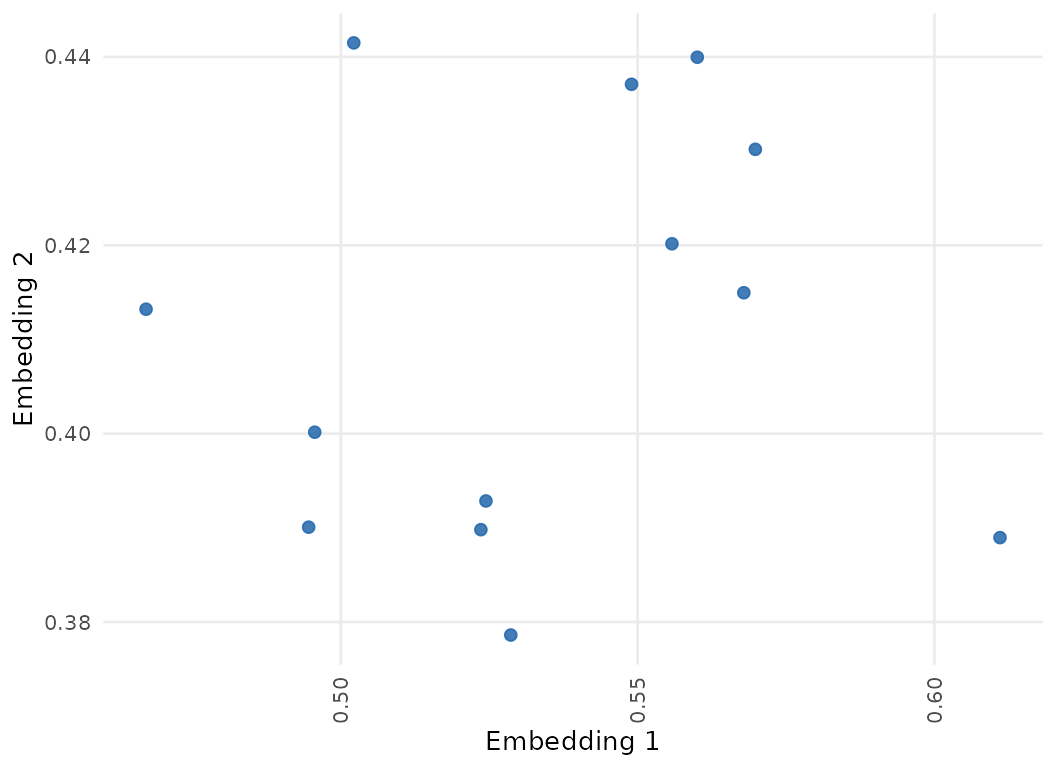
QC
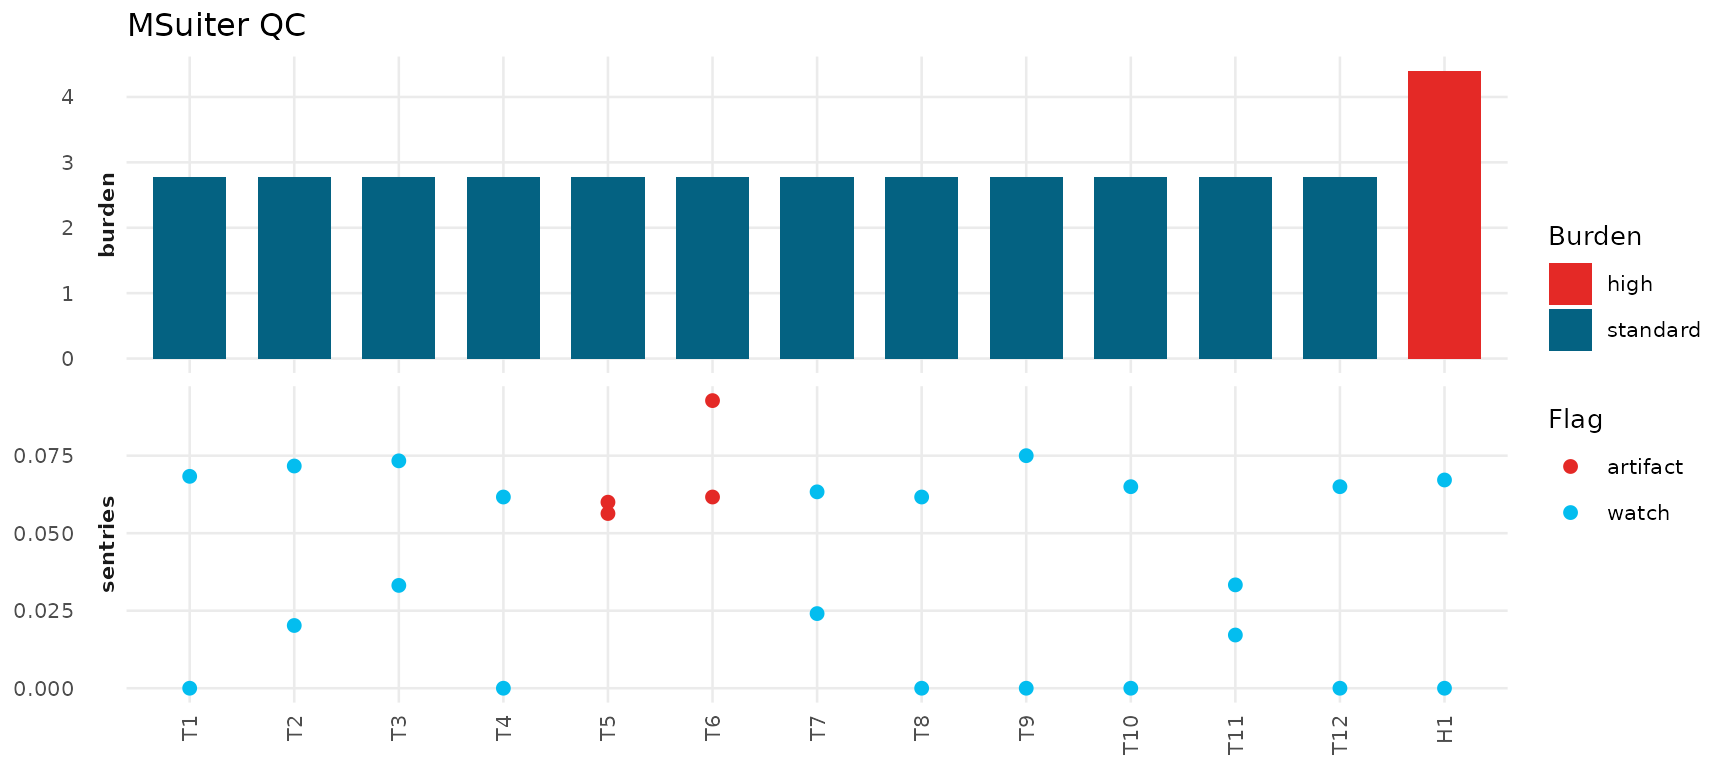
plot_qc_dashboard() is for reading per-sample burden and
the artifact sentries on one shared sample axis, drawn exactly as the QC
report stored them – burden classes on the top panel, the G>T and
C>T sentinel shares below, colored by the stored flags.
plot_pseudosig_contribution() is for ranking the
per-sample artifact share of the exposure, with the contributing
artifact signatures labelled and the flagged samples colored by their
verdict.
plot_pseudosig_contribution(roster)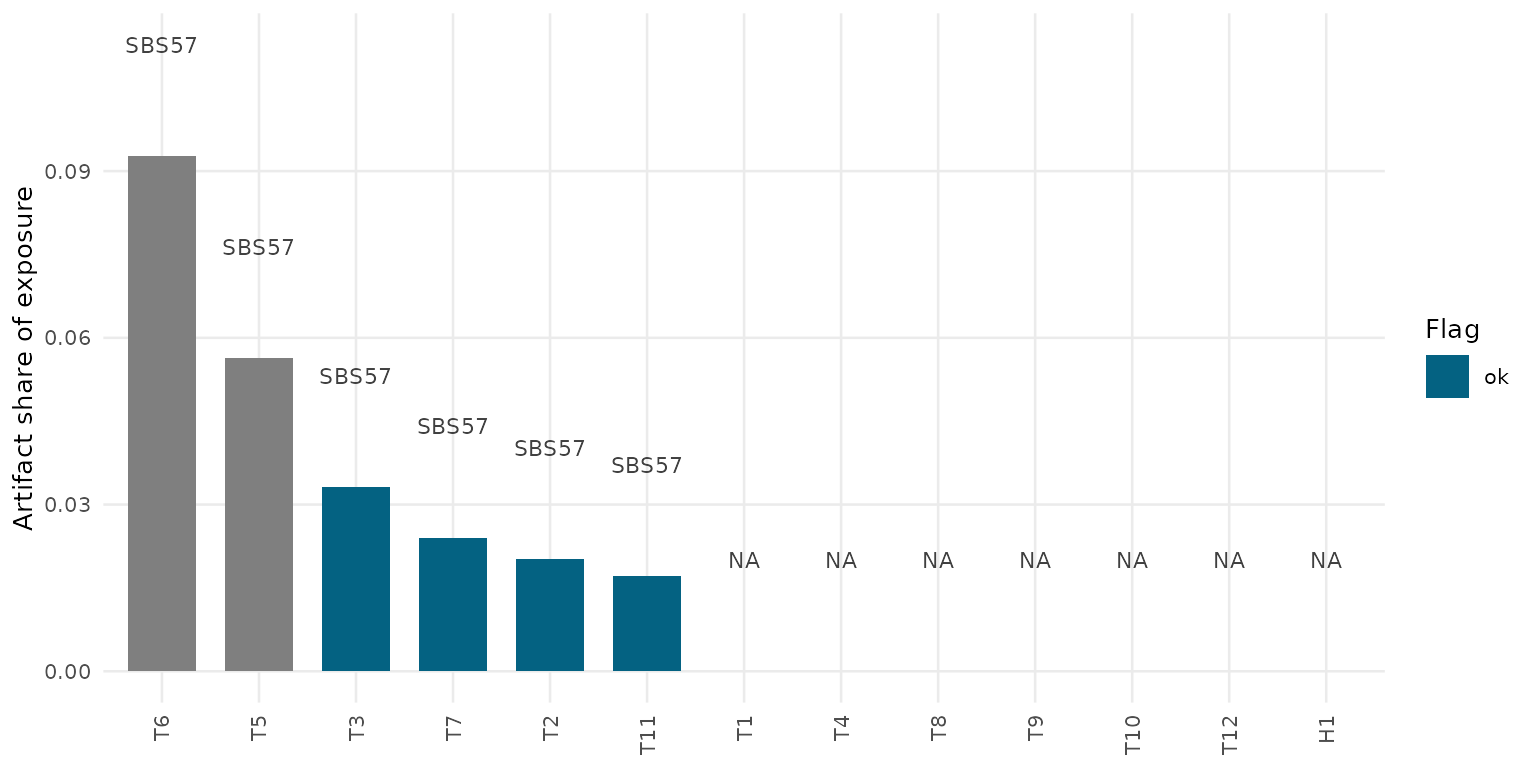
Where to go next
The figures above draw what the certified faces stored; the statistics behind the comparison machinery are the subject of Comparing signatures, and the QC surfaces themselves – the report, the roster share and their flags – are documented in Quality control.