![[Experimental]](figures/lifecycle-experimental.svg)
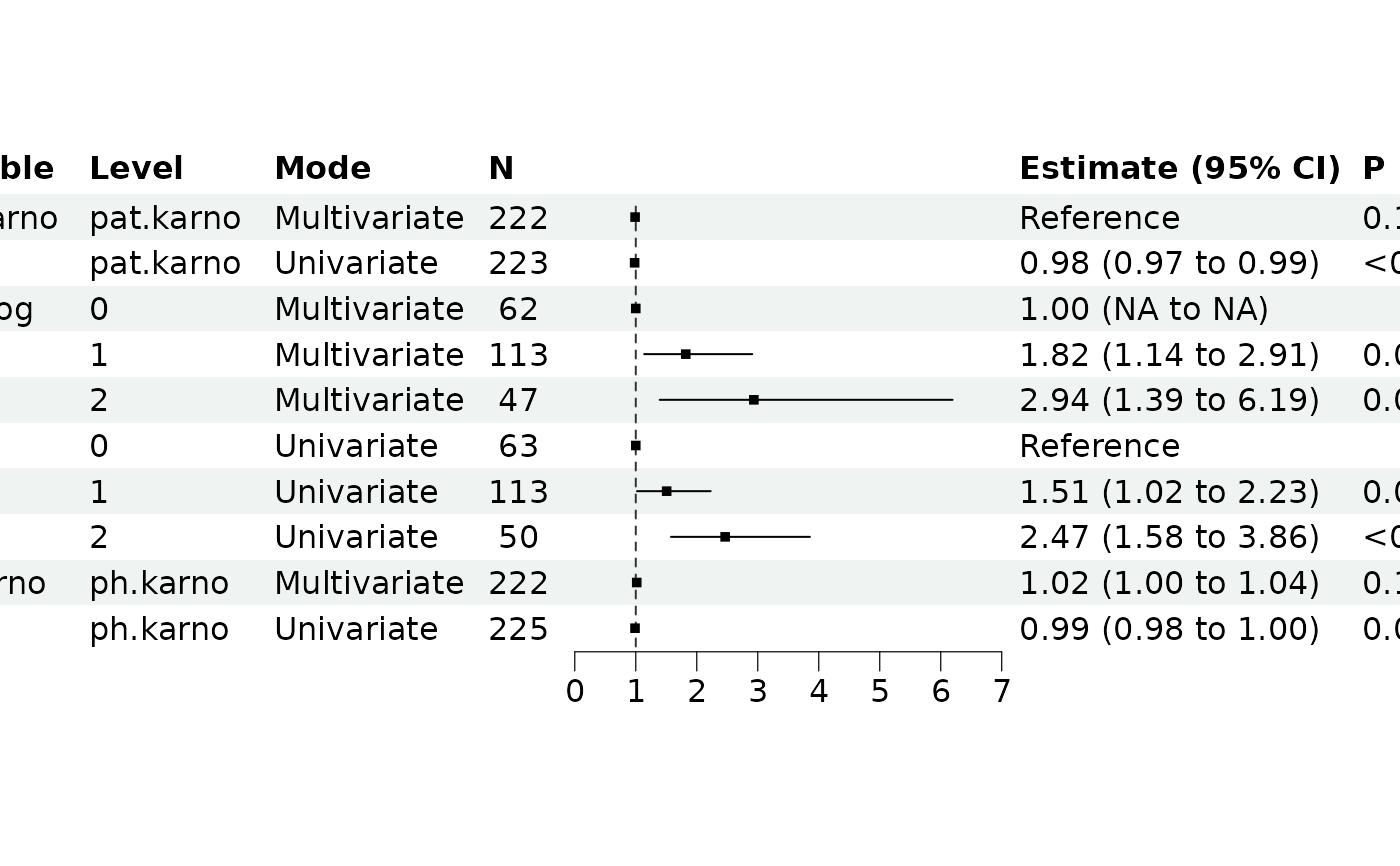
Creates a forest plot comparing univariate and multivariate model results side by side. Each variable shows estimates from both modeling approaches.
Arguments
- comparison
A
breg_comparisonobject frombr_compare_models().- ...
Additional arguments passed to
forestploter::forest().- xlim
Numeric vector of length 2 specifying x-axis limits.
- rm_controls
If
TRUE, show only focal variables (default).
See also
Other br_compare:
br_compare_models()
Examples
lung <- survival::lung |>
  dplyr::filter(ph.ecog != 3)
lung$ph.ecog <- factor(lung$ph.ecog)

comparison <- br_compare_models(
  lung,
  y = c("time", "status"),
  x = c("ph.ecog", "ph.karno", "pat.karno"),
  x2 = c("age", "sex"),
  method = "coxph"
)
#> Building univariate models...
#> exponentiate estimates of model(s) constructed from coxph method at default
#> Building multivariate model...
#> exponentiate estimates of model(s) constructed from coxph method at default

br_show_forest_comparison(comparison)