![[Experimental]](figures/lifecycle-experimental.svg)
This function builds both univariate models (each predictor separately) and a multivariate model (all predictors together), then combines the results for comparison. This is useful for understanding how predictor effects change when accounting for other variables.
Arguments
- data
A
data.framecontaining all necessary variables for analysis.- y
Character vector specifying dependent variables (response variables). For GLM models, this is typically a single character (e.g.,
"outcome"). For Cox-PH models, it should be a length-2 vector in the formatc("time", "status").- x
Character vector specifying focal independent terms (predictors). These will be modeled both individually (univariate) and together (multivariate).
- x2
Character vector specifying control independent terms (predictors, optional). These are included in all models (both univariate and multivariate).
- method
Method for model construction. See
br_set_model()for details.- ...
Additional arguments passed to
br_run().- n_workers
Integer, indicating number of workers for parallel processing.
- model_args
A list of arguments passed to
br_set_model().- run_args
A list of arguments passed to
br_run().
Value
A list with class breg_comparison containing:
univariate: breg object with univariate model resultsmultivariate: breg object with multivariate model resultscombined_results: Combined results data frame with amodecolumncombined_results_tidy: Combined tidy results with amodecolumn
See also
Other br_compare:
br_show_forest_comparison()
Examples
# Compare univariate vs multivariate for Cox models
lung <- survival::lung |>
dplyr::filter(ph.ecog != 3)
lung$ph.ecog <- factor(lung$ph.ecog)
comparison <- br_compare_models(
lung,
y = c("time", "status"),
x = c("ph.ecog", "ph.karno", "pat.karno"),
x2 = c("age", "sex"),
method = "coxph"
)
#> Building univariate models...
#> exponentiate estimates of model(s) constructed from coxph method at default
#> Building multivariate model...
#> exponentiate estimates of model(s) constructed from coxph method at default
# View combined results
comparison$combined_results_tidy
#> # A tibble: 4 × 9
#> Focal_variable term estimate std.error statistic p.value conf.low conf.high
#> <chr> <chr> <dbl> <dbl> <dbl> <dbl> <dbl> <dbl>
#> 1 ph.karno ph.kar… 0.988 0.00595 -2.06 3.96e-2 0.976 0.999
#> 2 pat.karno pat.ka… 0.981 0.00568 -3.30 9.64e-4 0.971 0.992
#> 3 ph.karno ph.kar… 1.02 0.00984 1.59 1.12e-1 0.996 1.04
#> 4 pat.karno pat.ka… 0.989 0.00723 -1.55 1.21e-1 0.975 1.00
#> # ℹ 1 more variable: mode <chr>
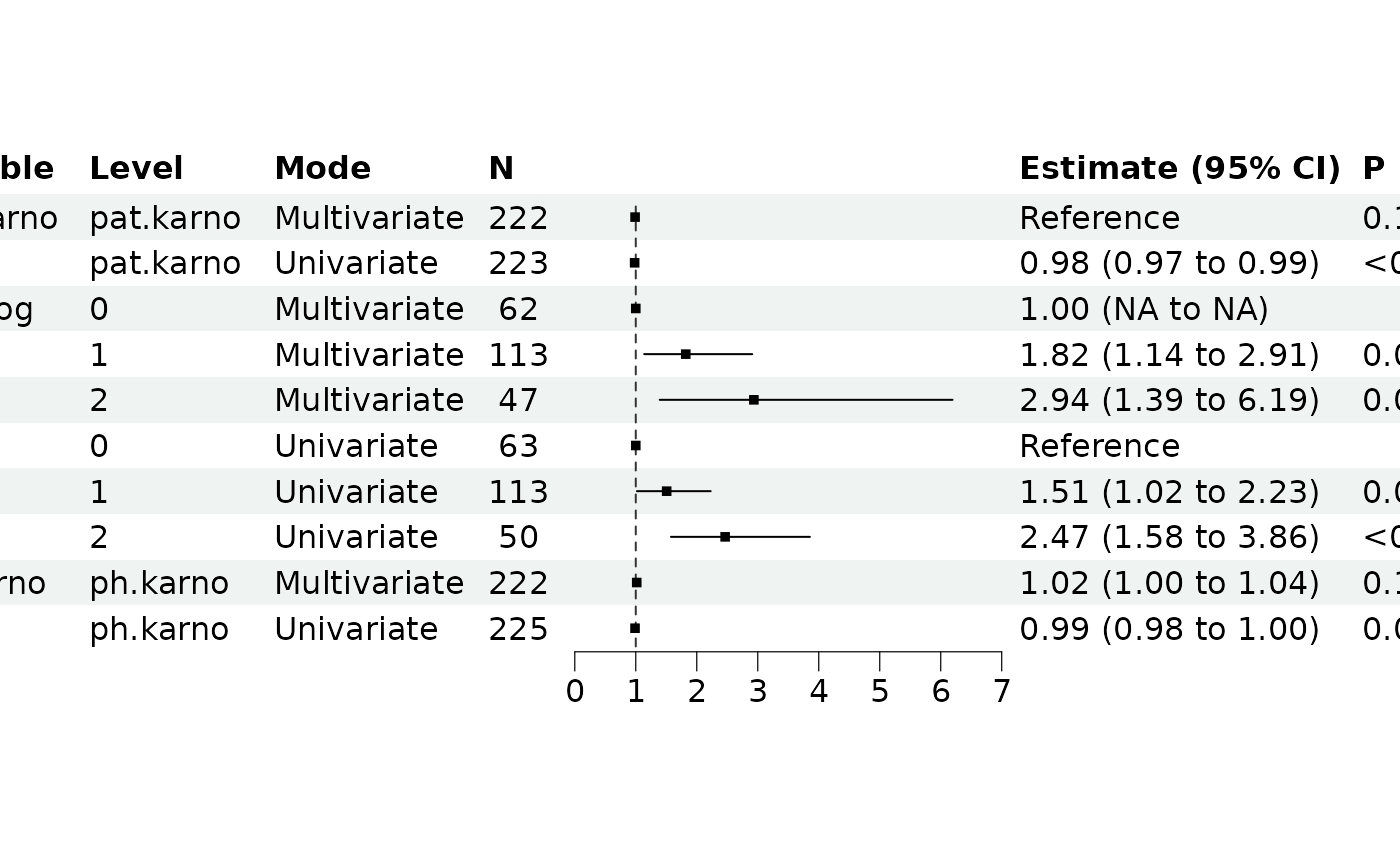
# Create forest plot comparison
br_show_forest_comparison(comparison)