Quick Start Guide for SigBridgeR
if (!requireNamespace("remotes")) {
  install.packages("remotes")
}
remotes::install_github("WangLabCSU/SigBridgeR")


# # Or install from r-universe:
# install.packages("SigBridgeR", repos = "https://wanglabcsu.r-universe.dev")

library(SigBridgeR)
library(Seurat)
We will start with a simple example.
if (requireNamespace("here", quietly = TRUE)) {
  setwd(here::here())
  knitr::opts_knit$set(root.dir = here::here())
}
library(zeallot) # %<-%
c(mat_exam, bulk_bi, pheno_bi) %<-% LoadRefData(data_type = "binary")
mat_exam is a single-cell RNA expression matrix,
bulk_bi is a bulk tissue RNA expression matrix, and
pheno_bi is the phenotypic data associated with
bulk_bi. When using a binary or continuous phenotype, the
reference phenotype data is a named vector.
head(pheno_bi)
# TCGA-CA-5256-01 TCGA-AZ-6599-01 TCGA-AA-3655-01 TCGA-A6-6137-01 TCGA-CK-4952-01 TCGA-A6-5657-01
#               1               1               1               1               1               1
By the way, when usinng a survival phenotype, the reference data is a data.frame.
pheno_sur <- LoadRefData(data_type = "survival")[[3]]
head(pheno_sur)
#               time status
# TCGA-69-7978  4.40      0
# TCGA-62-8399 88.57      0
# TCGA-78-7539 25.99      0
# TCGA-73-4658 52.56      1
# TCGA-44-6775 23.16      0
# TCGA-44-2655 43.50      0
The single-cell RNA expression matrix needs to be processed into a Seurat object. We set scale_features to all genes in order to maximize the flexibility of downstream analyses and capture a broader range of biological signals, so as to avoid insignificant results caused by too small a dataset.
seurat_obj <- SCPreProcess(
  mat_exam,
  quality_control.pattern = "^MT-",
  scale_features = rownames(mat_exam),
  dims = 1:20
)
Then we can use these data to screen out phenotype-assoicated cells. Let’s start by trying Scissor.
scissor_res <- Screen(
  bulk_bi,
  seurat_obj,
  pheno_bi,
  phenotype_class = "binary",
  screen_method = "Scissor",
  alpha = 0.05
)
Other screening methods are also available.
scpas_res <- Screen(
  bulk_bi,
  seurat_obj,
  pheno_bi,
  phenotype_class = "binary",
  screen_method = "scPAS",
  alpha = 0.05
)
Since the screening is performed on the same data, we merge them.
merged_seurat <- MergeResult(
  scissor_res,
  scpas_res
)
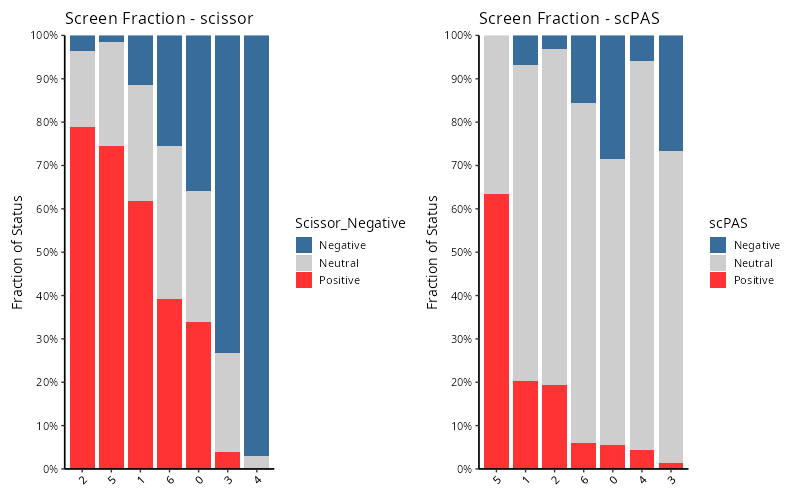
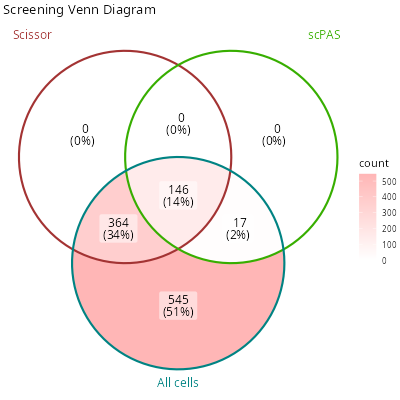
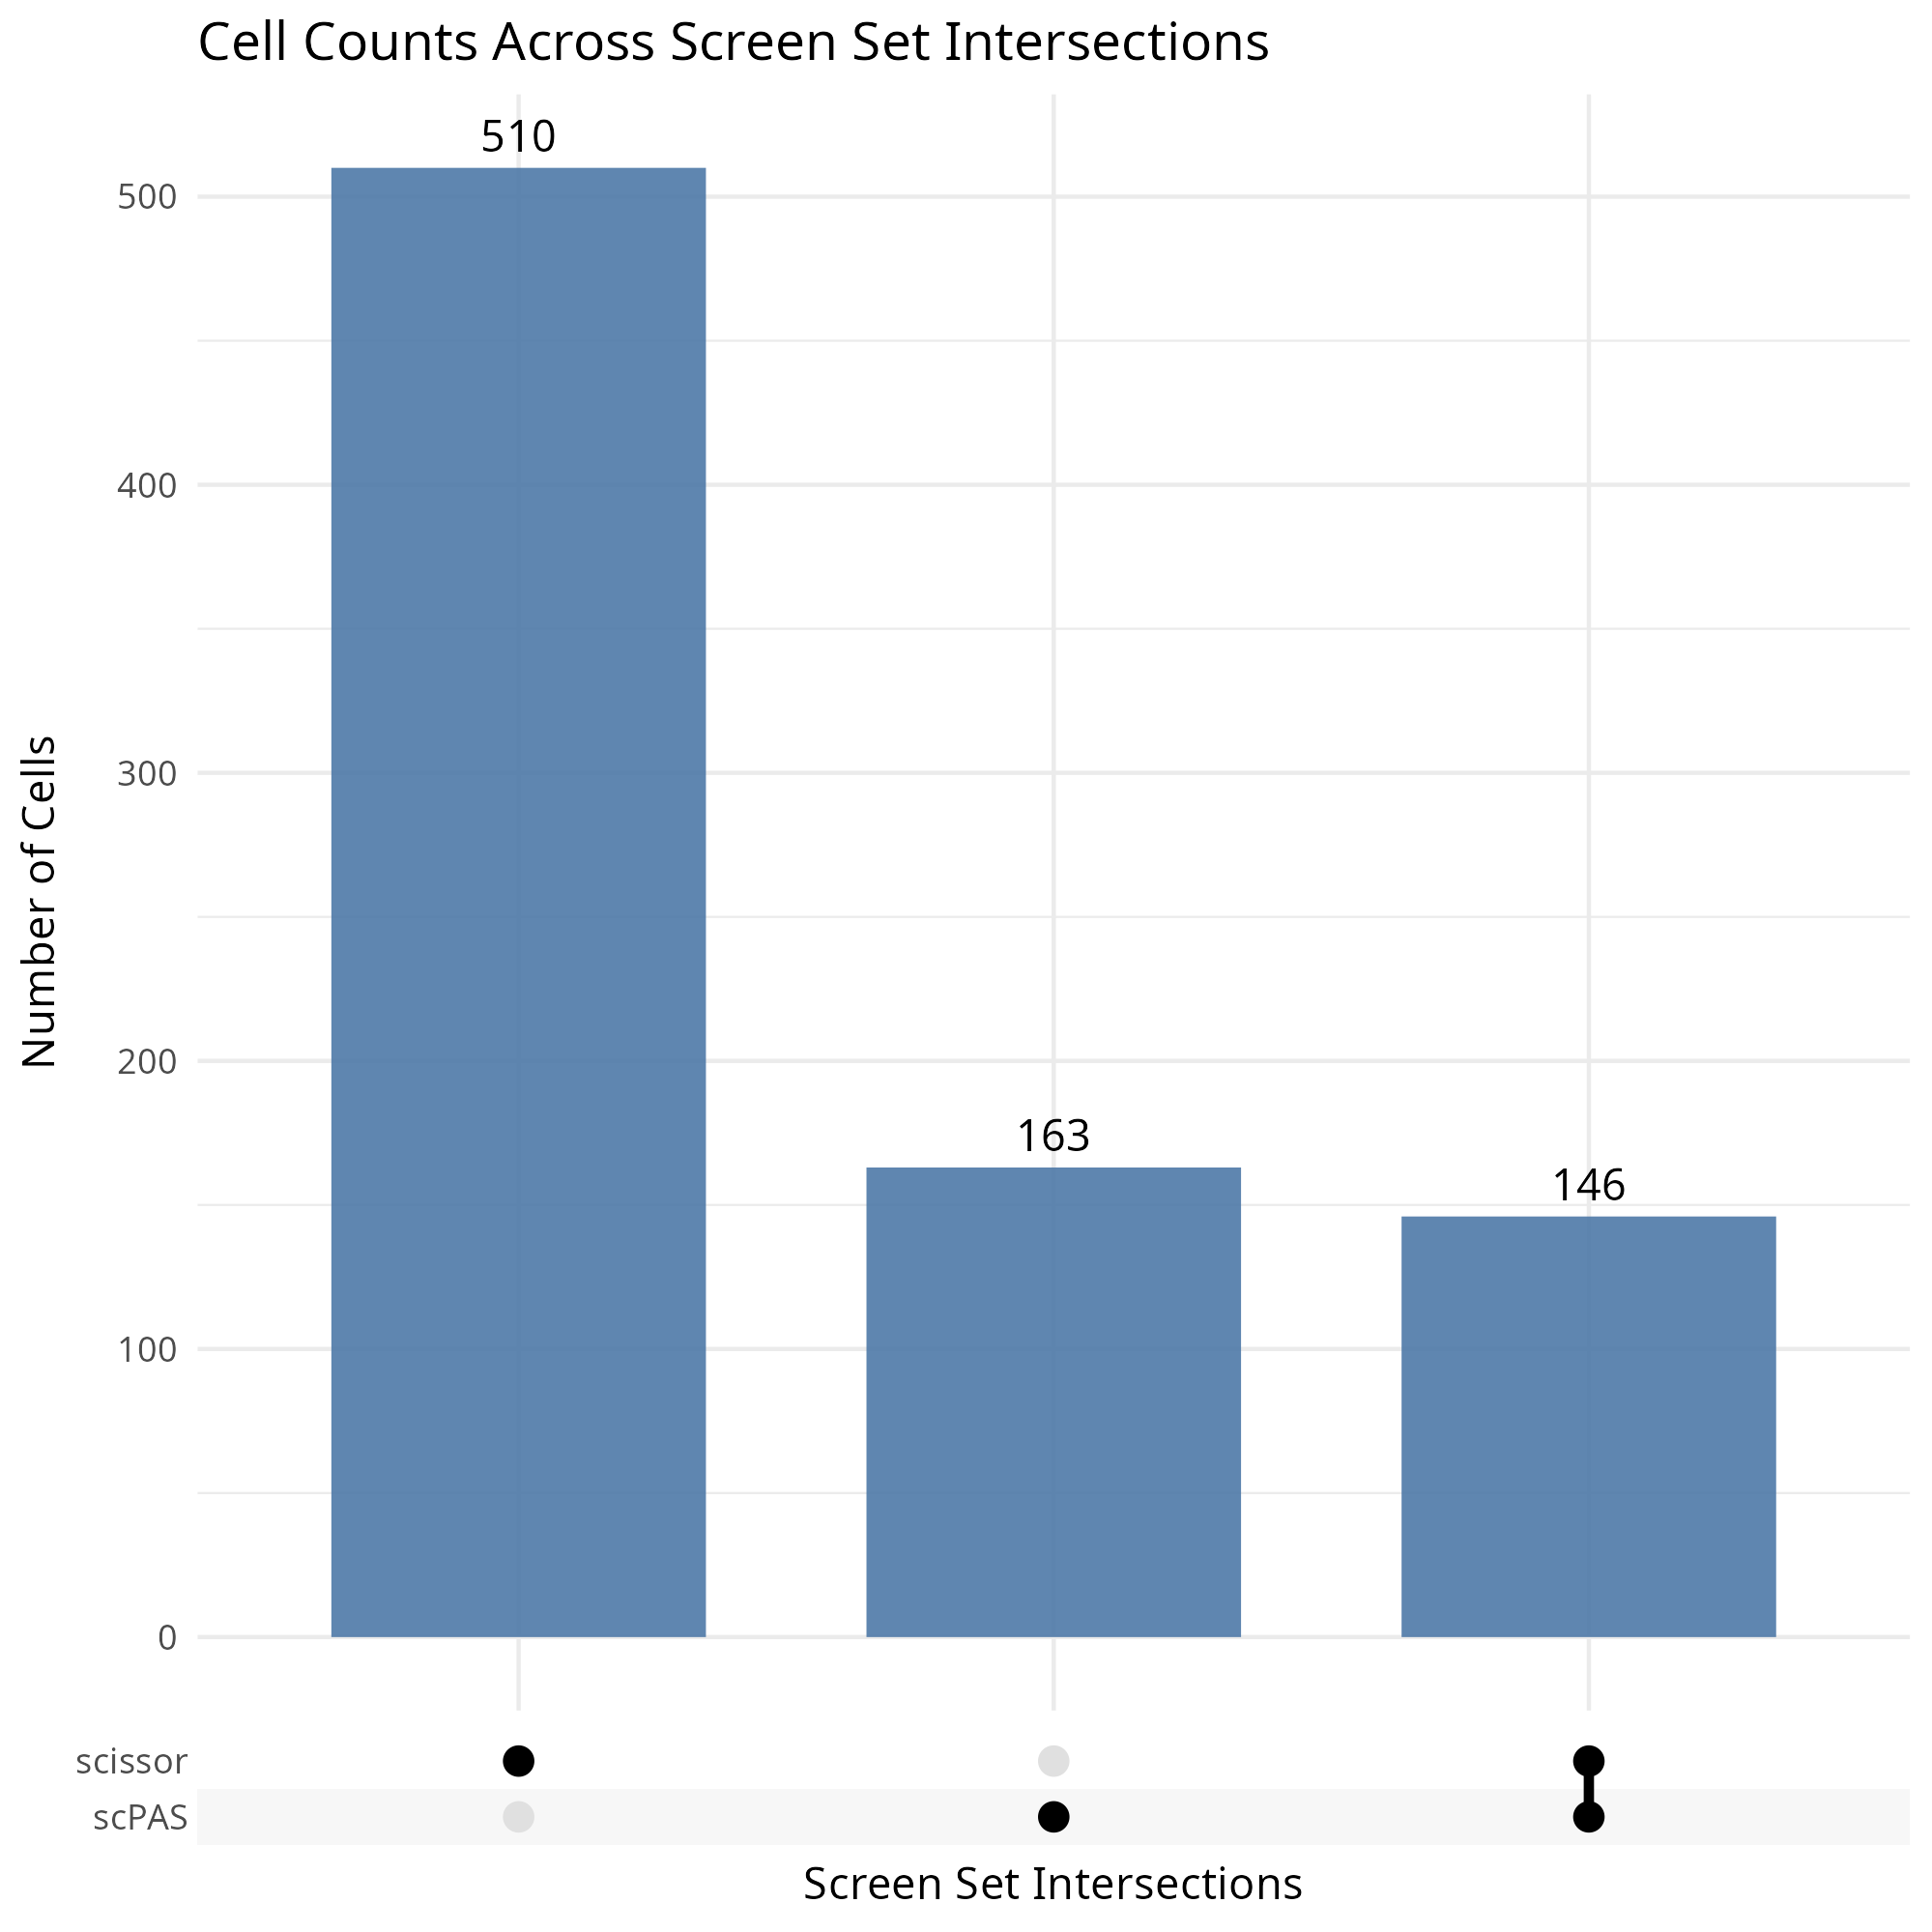
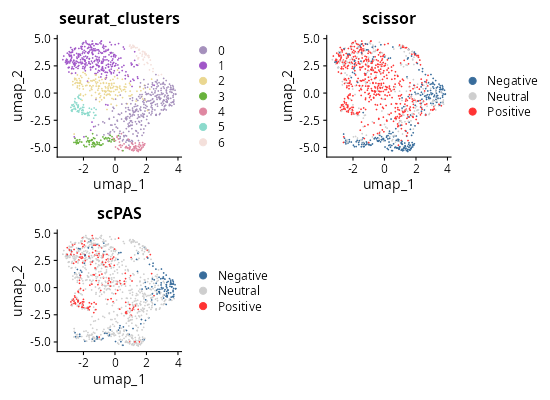
Finally, we visualize the screening results.
- stacked bar plot:
fraction = ScreenFractionPlot(
  merged_seurat,
  group_by = "seurat_clusters",
  screen_type = c("scissor", "scPAS")
)

# names(fraction)
# [1] "stats"         "plot"          "combined_plot"
knitr::include_graphics("vignettes/example_figures/fraction_q.png")- Venn diagram:
c(scissor_pos, scpas_pos) %<-%
  purrr::map(
    c("scissor", "scPAS"),
    ~ colnames(merged_seurat)[
      which(merged_seurat[[.x]] == "Positive")
    ]
  )

all_cells <- colnames(seurat_obj)

pos_venn = list(
  scissor = scissor_pos,
  scpas = scpas_pos,
  all_cells = all_cells
)

set.seed(123)

venn_plot = ggVennDiagram::ggVennDiagram(
  x = pos_venn,
  # * the labels of each group to be shown on the diagram
  category.names = c(
    "Scissor",
    "scPAS",
    "All cells"
  ),
  # * the colors of each group
  set_color = c(
    "#a33333ff",
    "#37ae00ff",
    "#008383ff"
  )
) +
  ggplot2::scale_fill_gradient(low = "white", high = "#ffb6b6ff") +
  ggplot2::ggtitle("Screening Venn Diagram")
knitr::include_graphics("vignettes/example_figures/venn_q.png")- Set plot:
upset <- ScreenUpset(
  merged_seurat,
  screen_type = c("scissor", "scPAS")
)
knitr::include_graphics("vignettes/example_figures/upset_q.png")- 2D UMAP:
library(patchwork)
library(randomcoloR)

c(
  scissor_umap,
  scpas_umap
) %<-%
  purrr::map(
    c("scissor", "scPAS"),
    ~ Seurat::DimPlot(
      merged_seurat,
      group.by = .x,
      pt.size = 0.1,
      reduction = "umap",
      cols = c(
        "Neutral" = "#CECECE",
        "Positive" = "#ff3333",
        "Negative" = "#386c9b"
      )
    ) +
      ggplot2::ggtitle(.x)
  )

set.seed(123)
cols = randomcoloR::distinctColorPalette(
  length(unique(merged_seurat$seurat_clusters)),
  runTsne = TRUE
)

cluster_umap <- Seurat::DimPlot(
  merged_seurat,
  group.by = "seurat_clusters",
  pt.size = 0.1,
  reduction = "umap",
  cols = cols
) +
  ggplot2::ggtitle("seurat_clusters")


# * Show
umaps = cluster_umap +
  scissor_umap +
  scpas_umap +
  plot_layout(ncol = 2)

umaps
knitr::include_graphics("vignettes/example_figures/umaps_q.png")Session information:
## R version 4.5.1 (2025-06-13)
## Platform: x86_64-pc-linux-gnu
## Running under: Ubuntu 24.04.3 LTS
##
## Matrix products: default
## BLAS:   /usr/lib/x86_64-linux-gnu/openblas-pthread/libblas.so.3
## LAPACK: /usr/lib/x86_64-linux-gnu/openblas-pthread/libopenblasp-r0.3.26.so;  LAPACK version 3.12.0
##
## locale:
##  [1] LC_CTYPE=C.UTF-8       LC_NUMERIC=C           LC_TIME=C.UTF-8
##  [4] LC_COLLATE=C.UTF-8     LC_MONETARY=C.UTF-8    LC_MESSAGES=C.UTF-8
##  [7] LC_PAPER=C.UTF-8       LC_NAME=C              LC_ADDRESS=C
## [10] LC_TELEPHONE=C         LC_MEASUREMENT=C.UTF-8 LC_IDENTIFICATION=C
##
## time zone: UTC
## tzcode source: system (glibc)
##
## attached base packages:
## [1] stats     graphics  grDevices utils     datasets  methods   base
##
## loaded via a namespace (and not attached):
##  [1] digest_0.6.37     desc_1.4.3        R6_2.6.1          fastmap_1.2.0
##  [5] xfun_0.53         cachem_1.1.0      knitr_1.50        htmltools_0.5.8.1
##  [9] rmarkdown_2.30    lifecycle_1.0.4   cli_3.6.5         sass_0.4.10
## [13] pkgdown_2.1.3     textshaping_1.0.4 jquerylib_0.1.4   systemfonts_1.3.1
## [17] compiler_4.5.1    tools_4.5.1       ragg_1.5.0        bslib_0.9.0
## [21] evaluate_1.0.5    yaml_2.3.10       jsonlite_2.0.0    rlang_1.1.6
## [25] fs_1.6.6          htmlwidgets_1.6.4


